
![]() By Joe Smith, CFA, CLS Investments
By Joe Smith, CFA, CLS Investments
Smart beta ETFs are generally geared for outperformance. They invest in pools of securities with a rules-based methodology that can be hard to beat. But as an ETF investor, it can be difficult to objectively evaluate smart beta ETFs with so many available in the marketplace and relatively small sample sizes used to compare live performance.
The idea behind modeling factors is that it can avoid some of these challenges by decomposing an ETF’s holdings based on common risks likely driving returns. However, the challenge for most investors is that they either a) don’t have access to cost-effective tools that provide them this type of portfolio lens and b) the output of such an analysis is not as intuitive as comparing excess returns versus a benchmark. Assuming an investor can get over these hurdles, the question is simple: Should a smart beta ETF behave the way the label suggests it will?
Compiling Data to Perform a Rigorous Exercise
As of May 31, 2018, there were more than 223 U.S.-based ETFs classified as smart beta, according to Morningstar. Among these ETFs, 53 target small-caps, 61 are single-factor ETFs (value, momentum, low volatility, and quality), 34 are multi-factor, 47 target a dividend strategy, and the remaining 89 focus on some other strategy, such as equal-weighting or risk-weighting.
In order to perform a comprehensive evaluation of each ETF, we pulled each one’s constituent holdings for either the end of May 2018 or the closest available date. We also pulled holdings for the iShares Russell 3000 ETF (IWV) to serve as our broad market proxy.
Next, we estimated a U.S. equity fundamental risk model. Using more than 3,000 securities available from Morningstar, we pulled characteristic-level data to proxy a market factor, a series of style factors (value, momentum, minimum volatility, and quality), and a series of GICS industry classifiers. This process was repeated over a three-year window on a monthly basis to calculate factor returns, factor risk estimates, and idiosyncratic risk estimates of each security. From there, we reviewed each ETF on a relative basis to IWV for its most recent holdings.
How Well-Engineered is Your Smart Beta ETF?
Reviewing the average active factor exposures relative to IWV for each category provides a high-level view of each group of ETFs’ key biases and factor influences embedded within its portfolio. All factors with positive active exposures relative to IWV (as defined as 0.25 or greater) are highlighted below in teal. Factors with negative active exposures relative to IWV (as defined by -0.25 or less) are highlighted in gold.
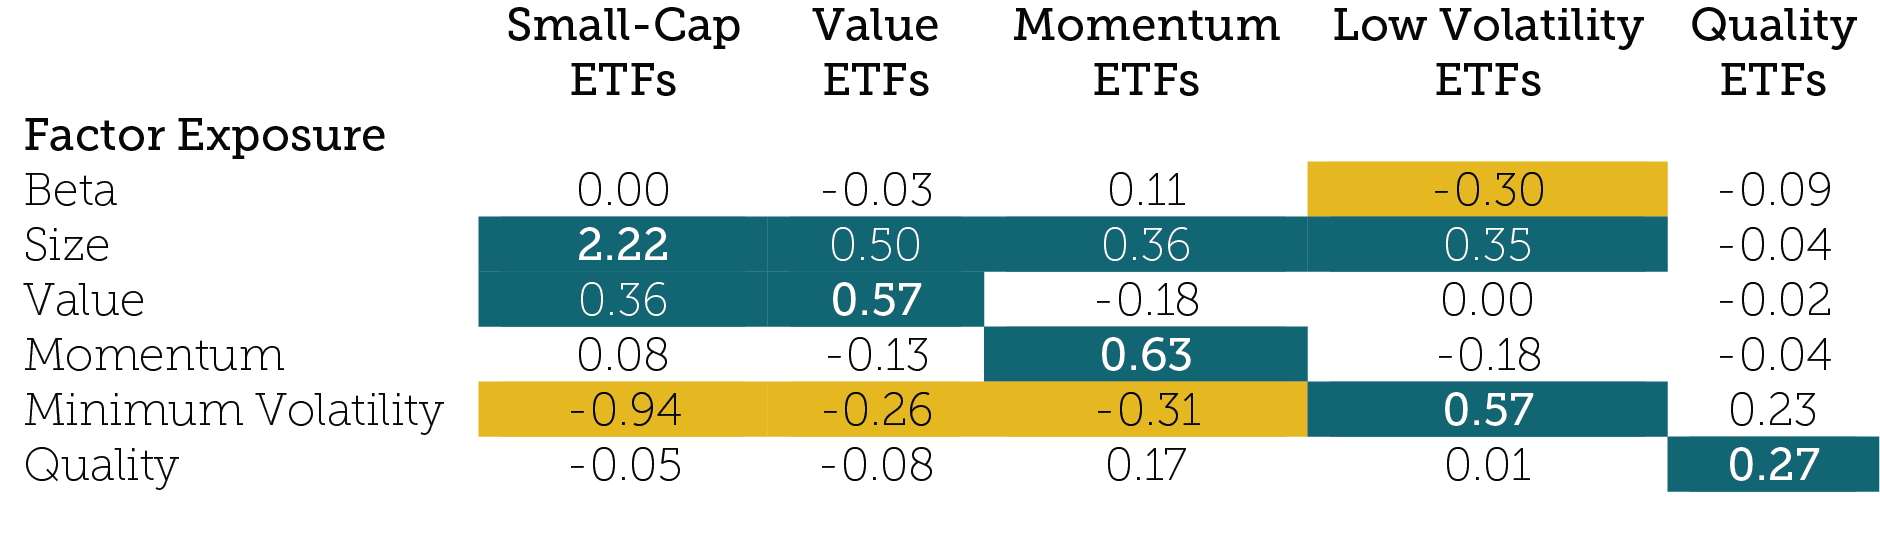
Source: Morningstar, CLS Investments. Data based on holdings as of approximately May 31, 2018.
The factor exposures of all smart beta ETFs in the analysis are generally in line with what they promise to deliver.
- Small-cap ETFs all have large tilts toward size but also pick up positive exposure to value at the expense of negative exposure to minimum volatility.
- Value ETFs on average have a positive tilt to value but also pick up a meaningful exposure to size and are slightly underexposed to minimum volatility.
- Momentum ETFs have strong positive tilts to momentum but also pick up a positive exposure to size and negative exposure to minimum volatility.
- Low-volatility ETFs have both negative exposure to beta and positive exposure to minimum volatility but again pick up some amount of positive exposure to size.
- Quality ETFs have a positive tilt toward quality, but all other factors are under our threshold of significance (although the positive tilt toward minimum volatility came very close).
So far so good. Let’s take a closer look at other smart beta ETFs investors generally evaluate.
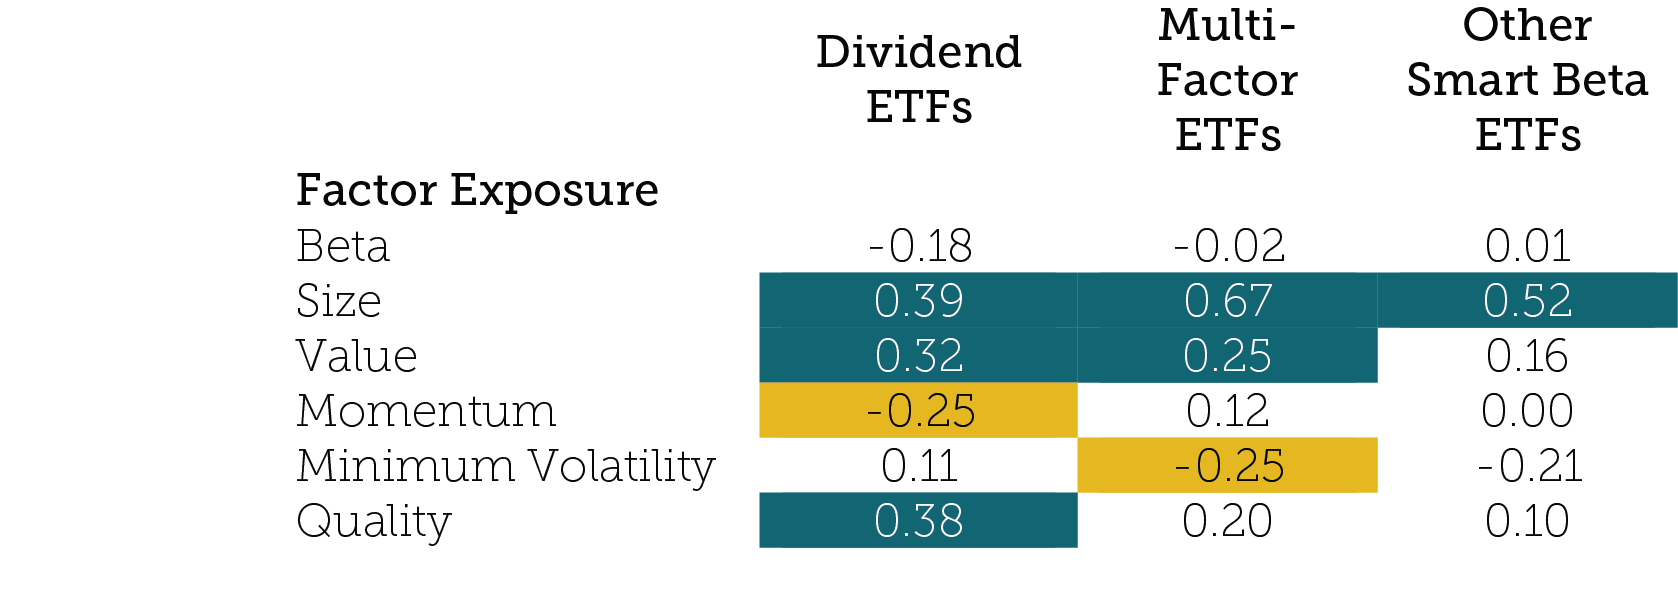
Source: Morningstar, CLS Investments. Data based on holdings as of approximately May 31, 2018.
In many ways, dividend ETFs can be viewed as the first iteration of smart beta ETFs. They generally target either high-dividend-yielding stocks or ones that have exhibited consistent dividend growth over time. On average, these ETFs have positive exposures to size, value, and quality and a modest negative exposure to momentum.
Multi-factor ETFs combine a number of factors, harvesting multiple sources of excess returns with a diversified approach. Our universe of multi-factor ETFs also exhibits strong positive exposures to size and value (with secondary positive exposures to quality and momentum) on average. These ETFs also typically have meaningful negative exposure to minimum volatility.
Finally, other smart beta ETFs primarily use alternative weighting schemes. Equal-weighting is the most common. Only size shows up as a significant positive exposure for these ETFs on average. The only other indirect tilts are a modest negative exposure to minimum volatility and slight positive tilts to value and quality.
How Much Risk Does Your Smart Beta ETF Provide?
We can also measure risk contribution using a factor model to determine whether these exposures will be the largest drivers of risk and return. This can be measured by expressing how much a factor contributes to the overall risk drivers of the portfolio. In this instance, we will look at active risk and tracking error.
