
By Clayton Fresk, Stadion Money Management
After spiking in the latter half of 2014 and churning higher in the latter part of 2016, the US Dollar has seen a rather steady decline in 2017 and thus far in 2018. However, there is still room to move lower before the currency hits levels where it traded during 2012-2014. So what ETFs are available to play this weaker dollar? I will touch on six different options below.
To isolate purer exposure to the dollar, I isolated ETFs with a strong negative correlation (< -0.80) over shorter term and longer-term periods. Not surprisingly there were only a handful of ETFs that rose to the top.
The most obvious would be UDN (PowerShares DB US Dollar Bearish). As the name states, the fund is positioned to be dollar bearish, taking long positions in a basket of currencies (futures contracts, with cash held as collateral). The current breakdown of exposure is as follows:
- Euro: 57.6%
- Japanese Yen: 13.6%
- British Pound: 11.9%
- Canadian Dollar: 9.1%
- Swedish Krona: 4.2%
- Swiss Franc: 3.6%
While UDN accomplishes the goal of positioning itself for a weaker dollar, there are a couple caveats which may give investors pause. First, the fund carries a 0.80% expense ratio, which could be a slight detriment in this new low-cost landscape. Second, based on the fund structure, it issues a K-1 rather than a 1099, which could be a tax situation for some investors. That being said, UDN has had a very limited distribution history, although there was a small return of capital distribution in 2017. Third, the fund has a rather small AUM (~$42MM) and trading volume (~80K shares or ~$1.8MM/day). While this should not be a trading issue given the extremely liquid underlying investments, it is something to at least be aware of. (As a point of comparison, UDNs bullish counterpart, UUP, has ~$512MM in AUM and trades about 1.6MM shares/day or ~$37MM/day).
If these caveats have investors struggling with using UDN, another purer currency choice could be FXE (CurrencyShares Euro Trust). Rather than a basket of securities, FXE will give 100% long exposure to the Euro (versus 57.6% as mentioned above for UDN). Although the fund has not had a distribution, it issues a 1099 rather than a K-1. It is also half the cost of UDN with a 0.40% expense ratio. Additionally, it has a larger AUM base and trading volume than UDN. The main drawback is that an investor would not have a diversified currency exposure in using FXE only. However, CurrencyShares offers ETFs for the other aforementioned currencies, so an investor could recreate the basket via multiple ETFs.
Outside these currency ETFs, another option would be to invest in an unhedged international bond ETF. Given the very low interest rate environment in which we currently reside, a significant portion of these bond ETFs returns are driven by the currency effect rather than the underlying bonds themselves.
If an investor would want to minimize the bond/rate ‘effect’ in order to strive for a strong negative dollar correlation, one place to start would be on the shorter part of the government curve. There are two ETFs that offer short duration government exposure:
- ISHG (iShares 1-3 Year International Treasury Bond)
- BWZ (SPDR Bloomberg Barclay’s Short Term International Treasury Bond)
These two ETFs are very similar in terms of exposure and cost, while BWZ has a larger AUM base and trading volume. However, the biggest difference is that ISHG invests only in developed markets exposure, while BWZ invests in emerging markets debt as well. In terms of currency exposure, this additional exposure accounts for about 19% of the fund. Here is a side-by-side chart, with the aforementioned UDN exposure added as reference:
![]()
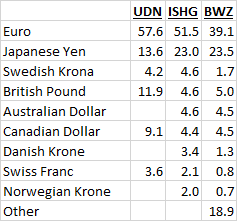
While this other in BWZ exposure can add some dispersion in terms of currency exposure versus ISHG, this other exposure also adds a layer of additional yield as an offset. Currently, this yield ‘buffer’ is approximately 0.57% based on the yields of the underlying indices for the respective fund (the yield differential has fluctuated between the 0.45% and 0.80% range since mid-2014, averaging about 0.65%).
