
 Solid Fundamentals Support the Strong Performance and May Help Sustain Future Gains
By J. Richard Fredericks, Main Management
Through the end of the third quarter, the Emerging Market category was the best equity class in terms of performance according to JP Morgan. The Emerging Market (EM) equity area posted an advance of 28.1% which contrasted with Developed Market (DV) gains of 20.5% and a gain in the S&P 500 over the same 9-month period of 12.5%.
That outperformance was a unique experience of late as the primary Emerging Market ETF (Symbol: EEM) has remained fairly flat over the past 5 years and only just recently attained higher levels. The current price of the Emerging Market ETF (EEM), which is shown below, has advanced 10.5% over the past five years as contrasted to the blistering 86.7% gain in the S&P 500.
Five Year Performance of the Emerging Market ETF (Symbol: EEM) as of 10/19/17
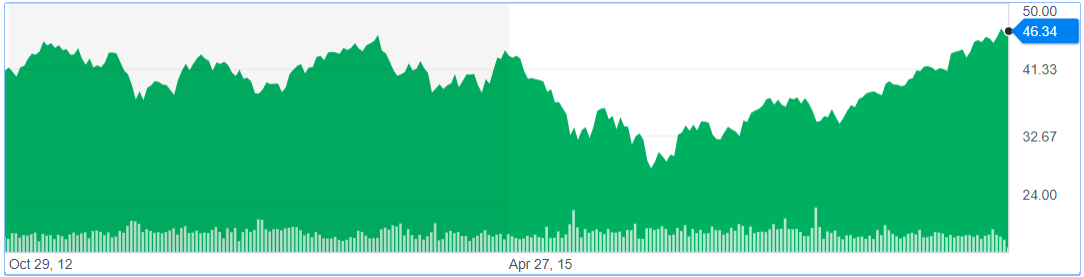
Source: Yahoo Finance
The story has been much more upbeat in 2017 as the Emerging Market ETF (EEM) has advanced by 30.0%, versus the 13.8% change in the S&P 500. Another EM investment vehicle to consider may be the iShares Core MSCI Emerging Markets ETF (IEMG) which has a lower expense ratio. Bloomberg characterized the recent emerging market performance a “shooting the lights out” and provided the following chart.
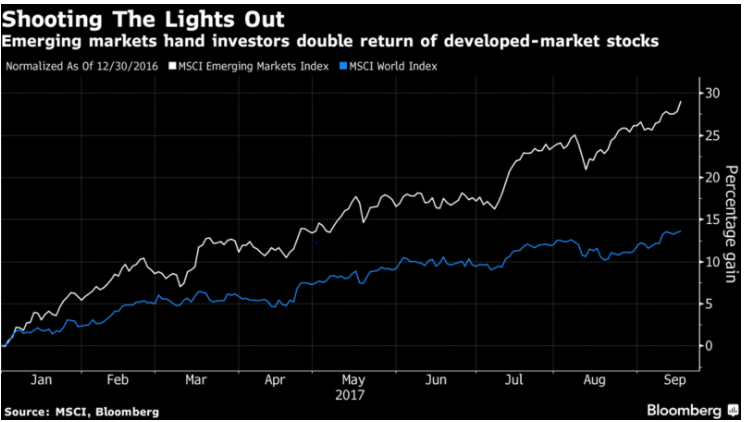
And more to the point, the MSCI Emerging Market Index has finally broken a bearish trendline that dates back to 2007.
![]()
We believe the strong recent performance is deserved as the fundamentals have notably improved. Some of the elements that have aided the performance and underpin a continuation of gains for Emerging Market stocks follow.
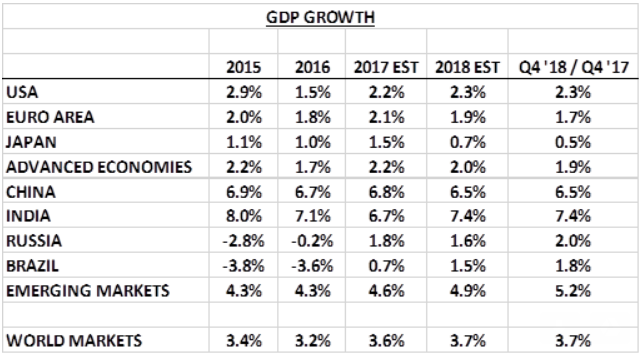
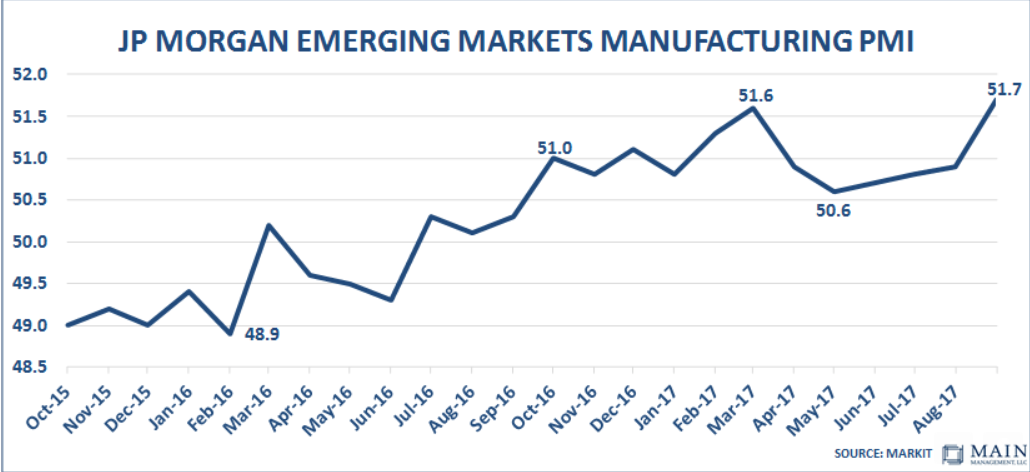
The Economy. The Global and Emerging Market economic backdrop has been improving. Based on International Monetary Fund (IMF) data, as can be seen below, the GDP of the Emerging Market area is re-accelerating. The expectation of the IMF in its October projections (see here, Chapter One, pages 14, 15) is that the growth rate of the Emerging Market Area economy will rise to 5.2% in the fourth quarter of 2018, a rate of change which is up from the 4.3% posted in 2016. With the exception of 2009, when EM growth was only 2.8%, the 4.3% growth rate in 2016 was the lowest growth posted for 15 years. Helping bolster the re-emergence of growth is a return to better numbers expected in Russia and Brazil, each of which posted negative changes in GDP for both 2015 and 2016. The second chart that follows indicates that the Purchasing Managers’ Index (PMI) figures for the Emerging Market countries is another indicator which shows the highest levels in over two years.
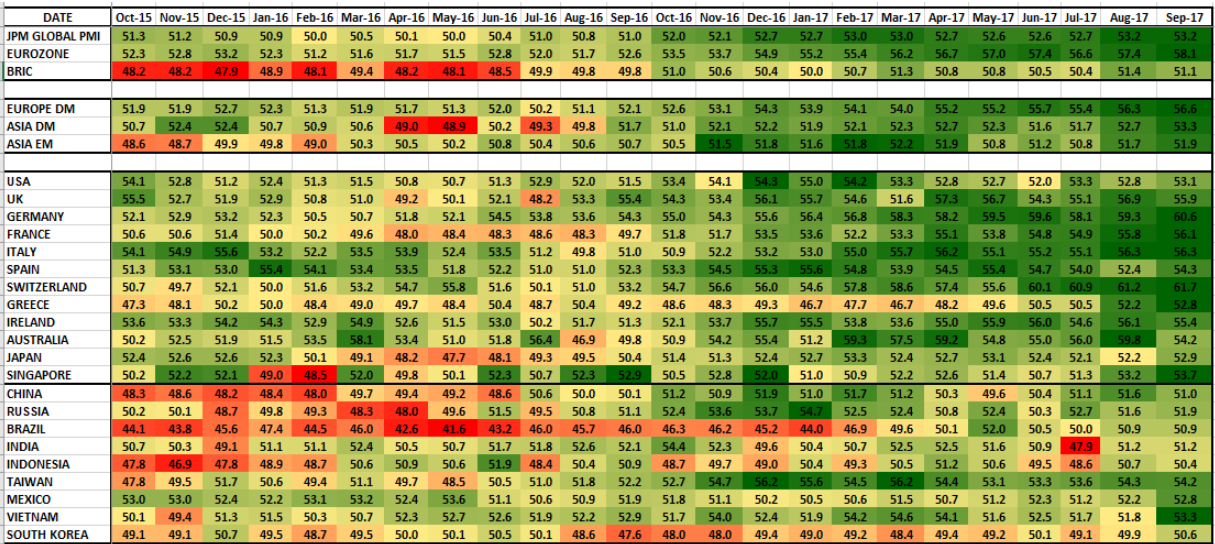
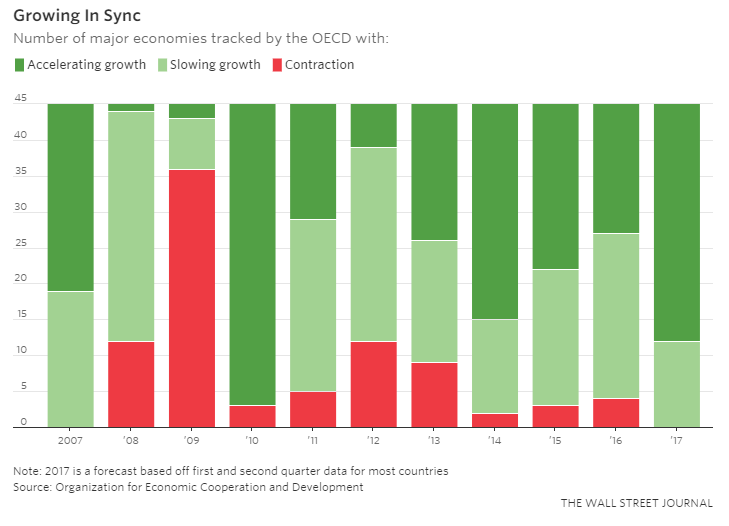
In our own work at Main Management, we track the PMIs of many individual countries and color code the trend with red registering the lowest experience and bright green the best. We further measure how many of the countries have scored above 50% which is the PMI distinction for growth. The second of these measures, which is shown on the next page, indicates that ALL of the countries, i.e., 100% of the countries we measure, are in a growth mode. That is the only time this measure has reached a 100% level in at least a decade! The positive growth with the Main Management Monitoring Measure coincides with a recent chart provided by the OECD and highlighted in the Wall Street Journal in which they indicate that none of their members is in a contraction mode (see third chart below).
Main Management PMI Monitoring Measure

 It shouldn’t be a surprise that Emerging Markets typically grow faster than developed markets given where they are in their economic development. Indeed, using the IMF figures, as provided nearby, the Emerging Markets have always grown at more than twice the rate of the Developed Markets and the IMF estimates indicate that the Emerging Markets will be exiting 2018 at the fastest growth since 2013.
