
By Gary Stringer, Kim Escue and Chad Keller, Stringer Asset Management
Across the board, our strategies are roughly in-line with our long-term risk targets to equity, fixed income and alternative investments. Our base-case scenario is that the current business cycle has years, not months, to run.
Our outlook continues to be constructive and we think that second quarter GDP growth will come in near 2.5%. Additionally, we maintain our expectation of 2.2% real GDP growth for calendar year 2017, though we have revised down our inflation expectations, which impacts our forecast for nominal GDP growth and long-term interest rates. These slight downward revisions reflect both the decline in market-based inflation expectations and the lack of offsetting fiscal stimulus that we expected from Washington, D.C.
In generating long-term forecasts for real GDP (not including the inflation factor), we think about the growth rate of the labor force and labor force productivity. Productivity is more difficult to forecast because it is based largely on new technologies and innovation. The Bureau of Labor Statistics forecasts annual labor force growth of roughly 0.5% and approximately 1.8% for productivity growth, for our 2.2% real GDP forecast.
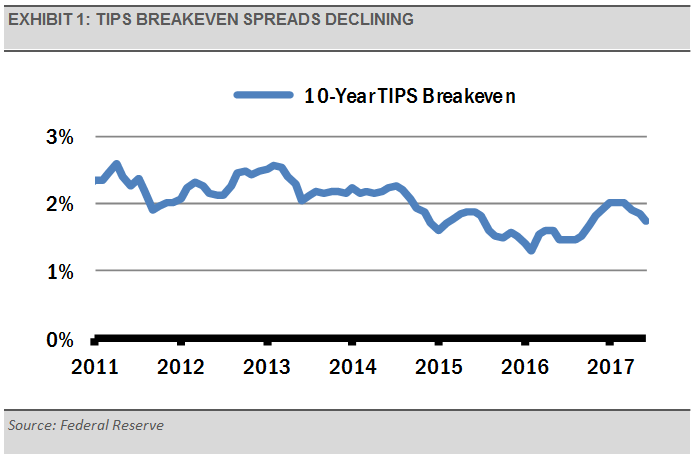
To create a forecast for nominal GDP, we include an inflation factor using market-based inflation expectations as a proxy for what to expect going forward. We like to use the relationship between Treasury Bonds and Treasury Inflation Protected Securities (TIPS) of the same maturity, known as the TIPS breakeven spread, to derive what the market thinks inflation will be over the next several years (exhibit 1). These expectations have decreased in recent months, pulling our expectations for nominal GDP back down from 4.2% to 3.7%.
As investors, we think the economic implications of a U.S. Presidential election is often overblown by politicians and the media. Despite a lack of progress on tax reform and fiscal stimulus, it appears to us that old-fashioned private sector growth has taken hold in the U.S., as well as in Europe and Japan.
Our forecast for Fed policy has changed in recent months. Whereas we previously favored faster interest rate increases, we now think that there is a high probability that the Fed will slow the pace of rate hikes and begin letting their balance sheet shrink passively by not reinvesting proceeds from maturing securities. This should result in a somewhat tighter monetary policy, but the economy should continue to grow as long as the Fed does not go too far or too fast in tightening.
We have shown previously that nearly all recessions in the U.S. over the last 100 years have started with the Fed over-tightening monetary policy. Overall monetary conditions are not yet what we would consider tight, but we think the Fed has moved as much as they should for now.
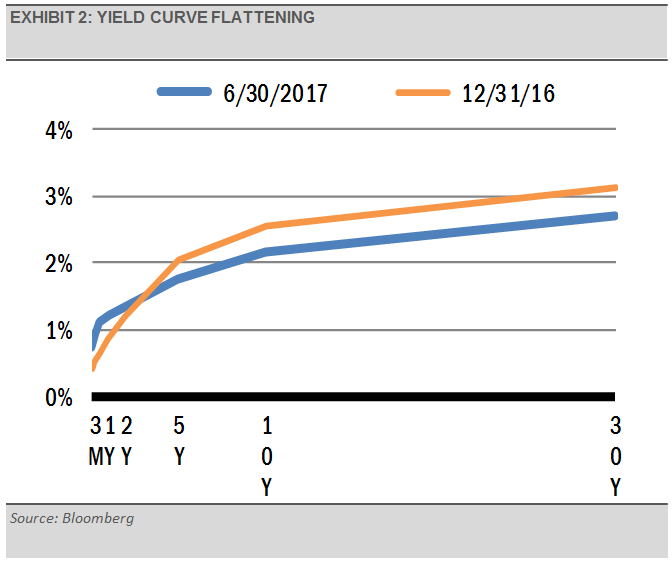
As shown above, market-based inflation expectations have declined at the same time the yield curve has flattened (exhibit 2). Together, these indicators suggest that broad inflationary pressures are lacking even though the labor market might be considered tight.
Though the headline employment rate (U-3) and the underemployment rate (U-6) have both recovered to pre-crisis levels, wages are still not growing quickly and the unemployment rate for prime age workers, those 25-54 years old, is still higher than before the global financial crisis. This suggests to us that there is still slack in the labor markets.
In aggregate, these measures, and others, tell us that inflationary pressure is subdued and there is still some room for labor market growth. As a result, it appears that the Fed would be unlikely to achieve its goal of a 2% inflation target and full employment if they continue hiking interest rates at their recent pace.
If the Fed continues to be patient, we think the current business cycle can continue for years. An extended business cycle with a lack of inflationary pressure keeping the Fed at bay is one of the benefits of our sluggish but steady growth since 2009.
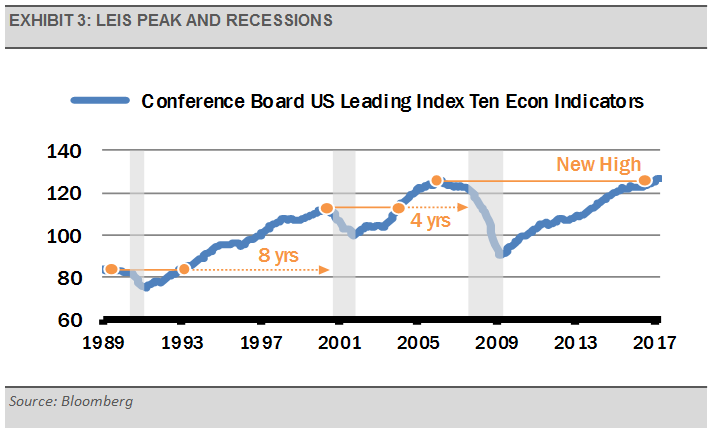
Overall, the leading economic indicators we follow remain constructive. For instance, the Conference Board Leading Economic Index (LEI) recently moved above its previous peak, suggesting that the U.S. economic expansion has years to run. As exhibit 3 indicates, once the LEI moves above its previous peak, the next recession is historically 4 to 8 years out. We believe that large equity market drawdowns of 20% or more are typically associated with recessions and the LEI’s history suggests that the next U.S. recession is years away.
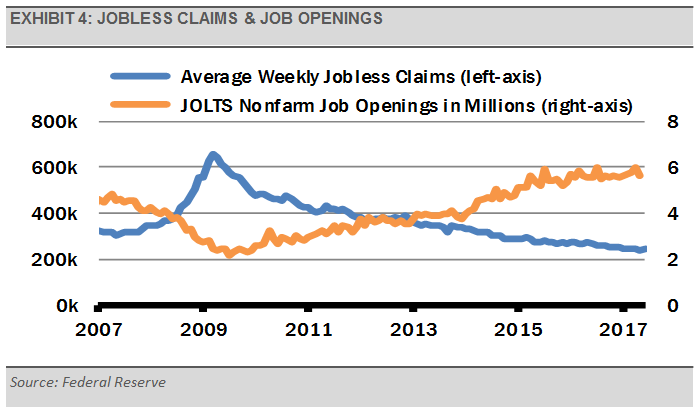
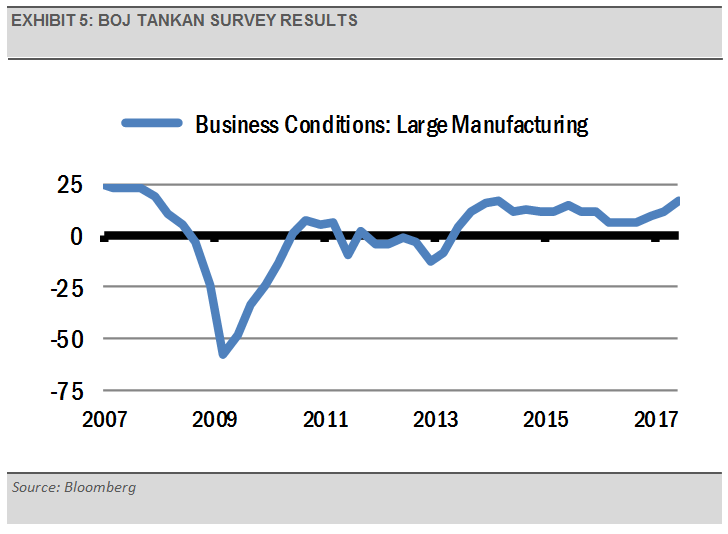
Looking at the U.S. labor market, layoffs, as measured by weekly jobless claims, remain near lows not seen in over 40 years. At the same time, job openings, as measured by the Job Openings and Labor Turnover Survey, are near all-time highs with about six million open jobs (exhibit 4). We are also seeing strong employment and business trends in Europe and Japan, where business confidence, as measured by the Bank of Japan’s latest “tankan” survey, is at its highest level in more than three years (exhibit 5). Additionally, new orders, which is a leading indicator, recently surged according to the latest J.P.Morgan Global Manufacturing & Services PMI report. This move higher reflects the sharpest accumulation of backlogs since November 2013. In fact, we are seeing accelerating rates of production and hiring as the capacity of manufacturers and service providers is being challenged.
INVESTMENT IMPLICATIONS
As the economy continues to grow, we expect corporate revenues and earnings to grow impressively (exhibit 6). Despite expected volatility, these growth rates represent positive trends for equities. With these positive trends in mind, it is a matter of finding the best opportunities within the global equity markets, in our view.
