
By hedging with long-term put options, the DRS has historically minimized the impact of those bear markets. The distribution of DRS returns is what one hopes to see – the majority of returns are clustered near the average of the distribution.
The long term returns of the Defined Risk Strategy are much more predictable. There isn’t a second peak to the distribution out in negative territory, like there is for the S&P 500.
Of course, by maintaining the hedge at all times, the DRS will lag in up markets. There will be fewer observations in the high-teens or over-20% range. However, that is a trade-off the DRS has willingly accepted. It has always been Swan’s philosophy that avoiding losses is more important than capturing all of the market’s gains.
The logic and justification for this are spelled out in our recent white paper “Math Matters” by Swan’s Director of Research, Micah Wakefield.
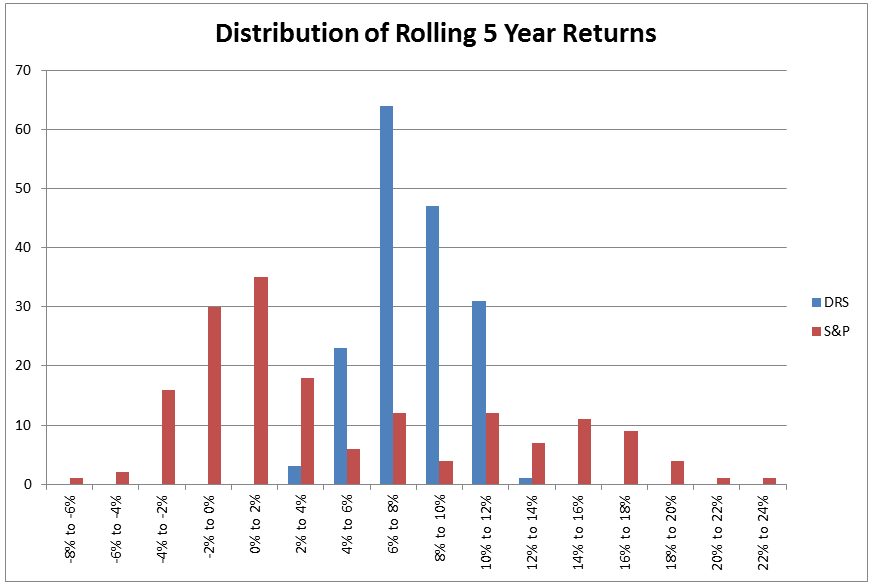
Compared to the S&P 500, the DRS’s annualized five-year returns look very appealing. Almost two-thirds of the 169 observations occurred in the 6% to 10% range. The two most common buckets for the S&P 500 were the -2% to 0% and 0% to 2% ranges.
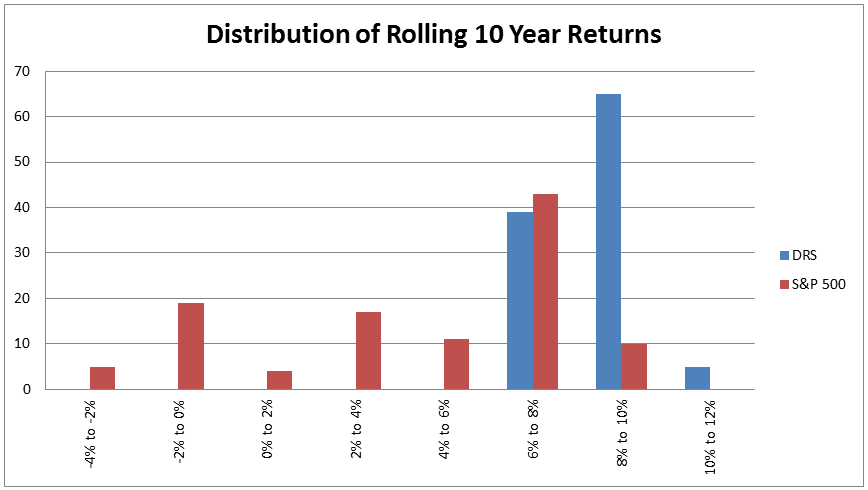
With a track record of 19 years, the sample size affords a healthy number of decade-long returns to analyze – 109 observations, in all. The long-term results of the DRS show a remarkable degree of consistency. Again, the value of hedging against bear market losses is easily illustrated in this chart.
Return Consistency Addresses Investment Timing Risk
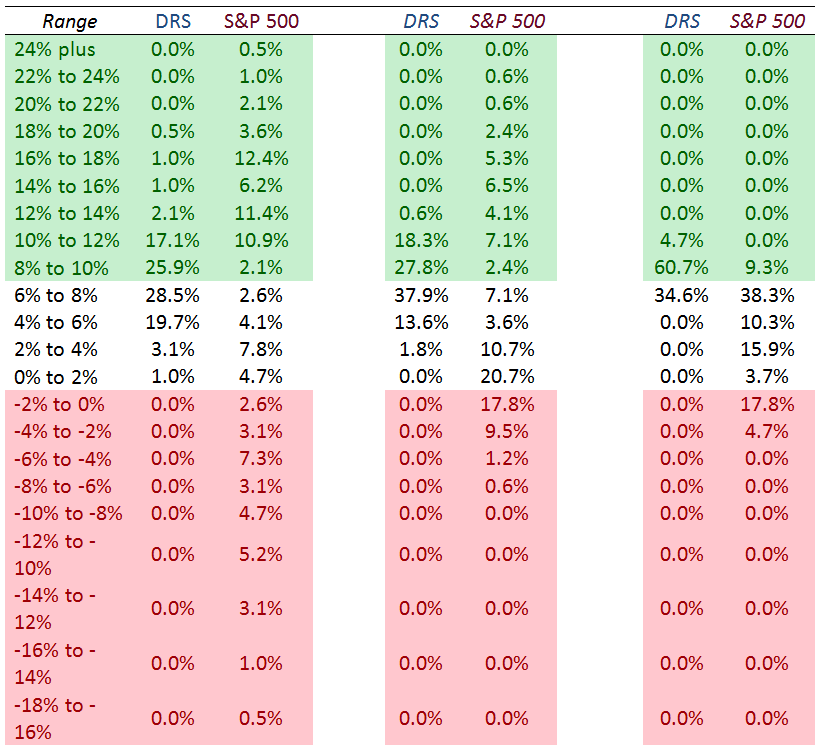
Another secondary, finer point of these charts has to do with timing.
At Swan we are often asked, “When is the best time to buy the DRS?” If an investor’s previous market experience has been in something like the S&P 500, it is a perfectly rational question to ask.
As we have seen, over the last 19 years one could have experienced radically different results, depending upon the time frame in question. However, the DRS almost renders this question moot as the range of outcomes has been very tight, as seen in the next table:
As Mr. Griffey said, it’s important not to get too high or too low.
Marc Odo is the Director of Investment Solutions at Swan Global Investments, a participant in the ETF Strategist Channel.
Important Disclosures:
Swan Global Investments, LLC is a SEC registered Investment Advisor that specializes in managing money using the proprietary Defined Risk Strategy (“DRS”). SEC registration does not denote any special training or qualification conferred by the SEC. Swan offers and manages the DRS for investors including individuals, institutions and other investment advisor firms. Any historical numbers, awards and recognitions presented are based on the performance of a (GIPS®) composite, Swan’s DRS Select Composite, which includes nonqualified discretionary accounts invested in since inception, July 1997, and are net of fees and expenses. Swan claims compliance with the Global Investment Performance Standards (GIPS®). All data used herein; including the statistical information, verification and performance reports are available upon request. The S&P 500 Index is a market cap weighted index of 500 widely held stocks often used as a proxy for the overall U.S. equity market. Indexes are unmanaged and have no fees or expenses. An investment cannot be made directly in an index. Swan’s investments may consist of securities which vary significantly from those in the benchmark indexes listed above and performance calculation methods may not be entirely comparable. All Swan products utilize the Defined Risk Strategy (“DRS”), but may vary by asset class, regulatory offering type, etc. Accordingly, all Swan DRS product offerings will have different performance results, and comparing results among the Swan products and composites may be of limited use. Economic factors, market conditions, and investment strategies will affect the performance of any portfolio and there are no assurances that it will match or outperform any particular benchmark. Therefore, comparing results shown to those of such indexes may be of limited use. The adviser’s dependence on its DRS process and judgments about the attractiveness, value and potential appreciation of particular ETFs and options in which the adviser invests or writes may prove to be incorrect and may not produce the desired results. There is no guarantee any investment or the DRS will meet its objectives. All investments involve the risk of potential investment losses as well as the potential for investment gains. This analysis is not a guarantee or indication of future performance. Prior performance is not a guarantee of future results and there can be no assurance, and investors should not assume, that future performance will be comparable to past performance. All investment strategies have the potential for profit or loss. Further information is available upon request by contacting the company directly at 970.382.8901 or visit swanglobalinvestments.com. 167-SGI-071116