
By Confluence Asset Allocation Committee
The rapid rise in longer duration Treasury yields since the presidential election has been surprising. As of December 8, the 10-year T-note yield was approximately 2.40%.
Although President-elect Trump’s policies will probably be inflationary, it is still unclear how much of his arguably vague plans will get passed. It is possible the FOMC will become more hawkish and we have seen some increase in rate hike expectations.[1]
Still, our 10-year T-note model is putting the fair value yield at 1.85%. Assuming fed funds at 1.25% still only raises the 10-year rate to 2.20%. Taking oil to $60 and assuming the 1.25% fed funds only raises the fair value yield to 2.27%.
Only when assuming steady oil, fed funds at 1.25% and German bunds at 1.25% (up from the current 33 bps) does the yield even reach 2.40%. The current spike in yields can be best justified by assuming a significant jump in inflation expectations.
In our yield model we use the 15-year average of CPI as a proxy for inflation expectations. This assumption comes from the work of Milton Friedman, who postulated that inflation expectations are derived over a long-term time frame.
We realize our calculation is a proxy but have refrained from using more market-based expectations because of their lack of predictability. If one assumes that nominal rates are the sum of the expectations of real rates plus inflation forecasts, inflation forecasts are very important to predicting nominal interest rates.
If the lifetime experience of inflation is important, then what is the most important age? We estimate that 60 is a reasonable age; the average age of the Senate is 61 years, the current FOMC average is 62 and the average age of an S&P 500 CEO is 57.[2] Simply put, it’s around the age of 60 that people come into power in politics and business. We believe that their personal experiences color the expectations of any investor and so using 60 as an influential age makes sense.
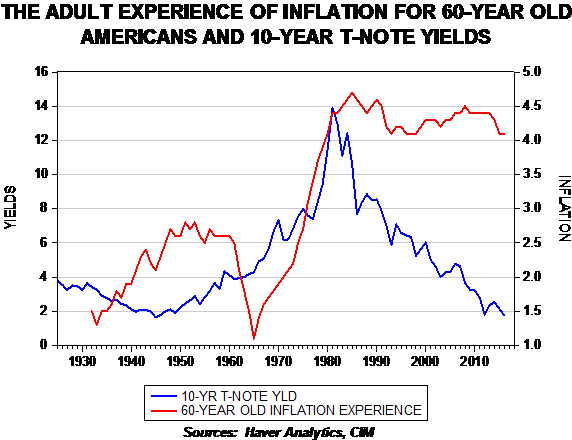
This chart shows the adult experience of inflation for a person turning 60 from 1932 to the present. To reflect the adult experience, we use the average annual change in CPI from ages 16 to 60.
Note that inflation experience rose into the late 1940s and stabilized into 1960, when it fell sharply. This was the generation that entered adulthood during the Great Depression.
It is interesting to note that as rates began to rise in the mid-1960s, the inflation experience steadily rose as well. Essentially, the rise in rates coincided with the rise in inflation experience.
