
Where could rates go from here
We believe that rates are likely to take a little bit of a breather here, after their sharp 2.5 week increase, until the market gets more clarity about the details of any stimulus plans and assesses their likelihood of being passed by the Republican controlled Congress. However, we believe that rates are likely to grind higher over the next several months, as the stimulus policies are unveiled. We believe that the 10-year Treasury yield is likely to test 3%, a level last seen at the end of 2013. We believe that any further yield increases will be driven by inflation and growth expectations. Headline inflation is currently running at 1.6% year-over-year, while core inflation (ex-food and energy) is at 2.1%. The 10-year real rate, as measured by the 10-year TIPS yield is currently around 0.4%, well below its long-term average of about 1.85%.The real rate is a measure of the yield that investors demand, above inflation, and is typically higher during periods of stronger economic growth. The break-even inflation rate for 10-year TIPS (nominal Treasury yield less TIPS yield) is currently 1.9%, between the current headline (1.6%) and core inflation (2.1%) rates. Interest rates could ultimately head higher if inflation expectations increase and/or stronger economic growth lead to a higher real rate.
What we like/dislike in Bonds
Last week’s Strategic View (dated 11/22/16) highlighted that we have lowered the average maturity and interest rate sensitivity (duration) of our portfolios pre- and post-election. In our Moderate Growth & Income bond portfolio, we have lowered duration from 7.3 years to about 4.1 years. We would summarize our current preferences as follows: 1) In general, we favor equities over fixed income. Our first line of defense in our balanced portfolios is to underweight bonds vs. equities; 2) We prefer bonds that act somewhat like stocks (high yield) and investment grade corporate bonds over Treasuries. We believe that Trump’s proposals would generally be favorable for corporate America – lower taxes, reduced regulatory burden, and stronger economic growth. Unfortunately, yields have fallen and credit spreads have tightened significantly from their wides in mid-February. Investment grade spreads are currently 136 bps (down from 221 bps on 2/11/16), and short-term high yield spreads are 535 bps (down from 1071 bps). Thus, future potential spread tightening (especially on investment grade corporate bonds) is unlikely to be able to fully offset a large increase in Treasury yields going forward; 3) We prefer shorter duration over longer duration bonds. We believe that it is prudent to accept the lower yields associated with shorter-term bonds in order to preserve capital in a rising rate environment.
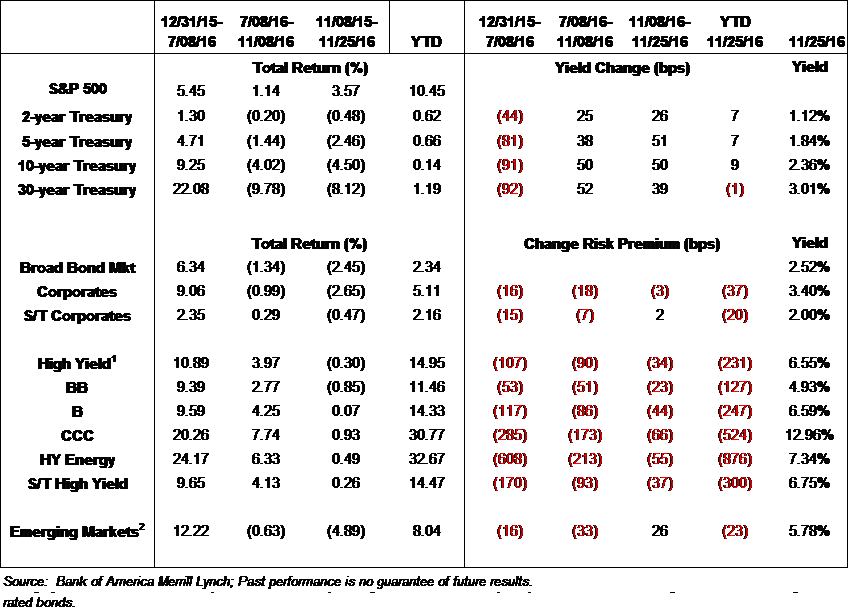
Chart 2: Summary Table
Source: RiverFront Investment Group, Bank of America Merrill Lynch.
The above chart is for illustrative purposes only and in no way related to RiverFront’s portfolio performance. Past performance is no guarantee of future results. See next page for index definitions.
1. High-yield securities (including junk bonds) are subject to greater risk of loss of principal and interest, including default risk, than higher-rated securities.
2. Investments in international and emerging markets securities include exposure to risks such as currency fluctuations, foreign taxes and regulations, and the potential for illiquid markets and political instability
Tim Anderson, CFA, is Chief Fixed Income Officer at RiverFront Investment Group, a participant in the ETF Strategist Channel.
Index Definitions for Chart 2:
It is not possible to invest directly in an index.
- Standard & Poor’s (S&P) 500 Index measures the performance of 500 large cap stocks, which together represent about 75% of the total US equities market.
- Broad Bond Market is measured using the BofA Merrill Lynch US Corporate, Government & Mortgage Index, which tracks the performance of US dollar denominated investment grade debt publicly issued in the US domestic market, including US Treasuries, quasi-governments, corporates, covered bonds and residential mortgage pass-throughs.
- Corporates is measured using the BofA Merrill Lynch US Corporate Index, which tracks the performance of US dollar-denominated investment grade corporate debt publicly issued in the US domestic market.
- S/T Corporates is measured using the BofA Merrill Lynch 1-3 Year US Corporate Index, which is a subset of The BofA Merrill Lynch US Corporate Index including all securities with a remaining term to final maturity less than 3 years.
- High Yield is measured using the BofA Merrill Lynch US High Yield Index, which tracks the performance of US dollar denominated below investment grade corporate debt publicly issued in the US domestic market.
- BB is measured using the BofA Merrill Lynch BB US High Yield Index, which a subset of the BofA Merrill Lynch US High Yield Index including all securities rated BB1 through BB3, inclusive.
- B is measured using the BofA Merrill Lynch Single-B US High Yield Index, which a subset of the BofA Merrill Lynch US High Yield Index including all securities rated B1 through B3, inclusive.
- CCC is measured using the BofA Merrill Lynch CCC & Lower US High Yield Index, which a subset of the BofA Merrill Lynch US High Yield Index including all securities rated CCC1 or lower.
- High Yield Energy is measured using the BofA Merrill Lynch US High Yield Energy Index is a subset of the BofA Merrill Lynch US High Yield Index including all securities of Energy issuers.
- Short-Term High Yield is measured using the BofA Merrill Lynch 1-5 Year US Cash Pay High Yield Index, which is a subset of The BofA Merrill Lynch US Cash Pay High Yield Index including all securities with a remaining term to final maturity less than 5 years.
- Emerging Markets is measured using the BofA Merrill Lynch BBB & Lower Sovereign USD External Debt Index, which tracks the performance of US dollar-denominated emerging market and cross-over sovereign debt publicly issued in the eurobond or US domestic market.
Important Disclosure Information
Past performance is no guarantee of future results.
Duration is a measure of the sensitivity of the price of a fixed income investment to a change in interest rates. Duration is expressed as a number of years. Rising interest rates mean falling bond prices, while declining interest rates mean rising bond prices.
In a rising interest rate environment, the value of fixed-income securities generally declines.
High-yield securities are subject to greater risk of loss of principal and interest, including default risk, than higher-rated securities.
Yield to worst is calculated on all possible call dates. It is assumed that prepayment occurs if the bond has call or put provisions and the issuer can offer a lower coupon rate based on current market rates. If market rates are higher than the current yield of a bond, the yield to worst calculation will assume no prepayments are made, and yield to worst will equal the yield to maturity. The assumption is made that prevailing rates are static when making the calculation. The yield to worst will be the lowest of yield to maturity or yield to call (if the bond has prepayment provisions); yield to worst may be the same as yield to maturity but never higher.
Buying commodities allows for a source of diversification for those sophisticated persons who wish to add this asset class to their portfolios and who are prepared to assume the risks inherent in the commodities market. Any commodity purchase represents a transaction in a non-income-producing asset and is highly speculative. Therefore, commodities should not represent a significant portion of an individual’s portfolio.
Stocks represent partial ownership of a corporation. If the corporation does well, its value increases, and investors share in the appreciation. However, if it goes bankrupt, or performs poorly, investors can lose their entire initial investment (i.e., the stock price can go to zero). Bonds represent a loan made by an investor to a corporation or government. As such, the investor gets a guaranteed interest rate for a specific period of time and expects to get their original investment back at the end of that time period, along with the interest earned. Investment risk is repayment of the principal (amount invested). In the event of a bankruptcy or other corporate disruption, bonds are senior to stocks. Investors should be aware of these differences prior to investing.
A basis point is a unit that is equal to 1/100th of 1%, and is used to denote the change in a financial instrument. The basis point is commonly used for calculating changes in interest rates, equity indexes and the yield of a fixed-income security. (bps = 1/100th of 1%)
RiverFront Investment Group, LLC, is an investment adviser registered with the Securities Exchange Commission under the Investment Advisers Act of 1940. The company manages a variety of portfolios utilizing stocks, bonds, and exchange-traded funds (ETFs). RiverFront also serves as sub-advisor to a series of mutual funds and ETFs. Opinions expressed are current as of the date shown and are subject to change. They are not intended as investment recommendations. Any discussion of the individual securities that comprise the portfolios is provided for informational purposes only and should not be deemed as a recommendation to buy or sell any individual security mentioned.
The BofA Merrill Lynch Current 10-Year US Treasury Index (GA10) is a one-security index comprised of the most recently issued 10-year US Treasury note. It is not possible to invest directly in an index. Copyright ©2016 RiverFront Investment Group. All rights reserved.
