Note: This article appears on the ETFtrends.com Strategist Channel
By Innealta Capital
In June, the British European Union membership referendum (colloquially, the “Brexit” vote), created widespread uncertainty and ultimately resulted in significant moves across global financial markets.
Investor demand for insurance, via the options market, reached levels not seen since the equity market trough of February 2016. Returns of “safe haven” and “risky” asset classes followed a traditional risk off behavior. Additionally, markets priced continued monetary policy support as the probability of FED rate hike in July fell from 35% to less than 5%. Such volatility spikes test the mental fortitude and investment thesis of every investor, regardless of experience level.
As a tactical portfolio manager, Innealta Capital views abrupt changes in volatility levels as a potential opportunity to rebalance portfolios in markets where price moves may have over- or under-reacted to macroeconomic fundamentals.
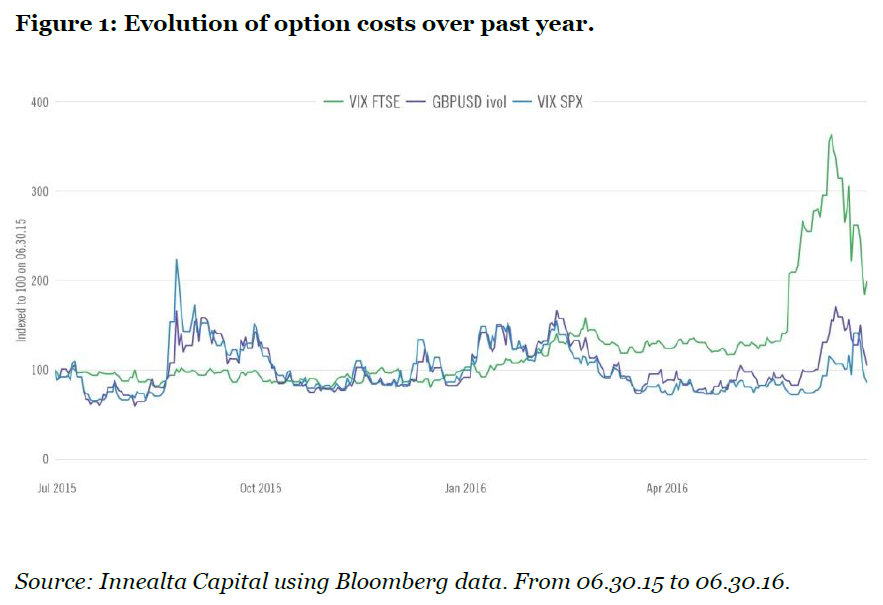
Although the timing of the British referendum was well known, the markets did not show signs of stress specific to this event until late May 2016. British pound foreign exchange (“FX”) options showed the first signs of stress and experienced significant moves relative to recent history.
As the referendum approached, fear began to spread. Using implied volatility as a proxy for option demand, hedgers continued to demand more FX options and moved hedges into equity markets such as the S&P500 and the FTSE 100. The CBOE VIX index reached levels exceeding those in the December 2015 – February 2016 market correction. Simultaneously, with this implied volatility spike, global equity markets sold off. After the referendum outcome, option demand declined and equity markets regained the majority of the drawdown.
Prior to the Brexit vote, markets anticipated a continued accommodative monetary policy and the referendum’s result only reinforced that view. As the news hit, world central banks reassured markets of ample liquidity. Fed fund futures at start of June implied a 35% probability of a FED rate hike.
After an unexpectedly low non-farm payrolls employment number, that probability fell to 21%, and as financial conditions tightened due to the Brexit, it further fell to less than 5%. The S&P 500 has historically outperformed during periods of accommodative monetary policy(1). In general, if macroeconomic growth does not change significantly, any oversold equity markets may appear attractive.
Related: Rising Interest Rates – A Review of Domestic vs. International Equity Performance
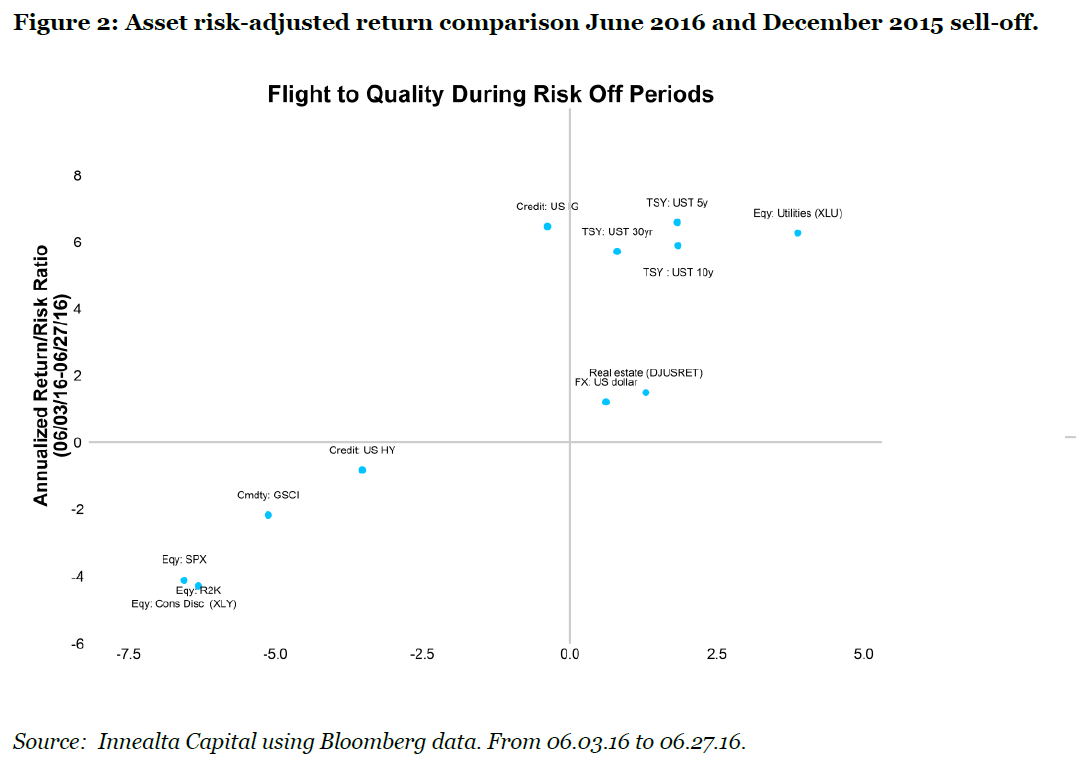
Another clue on whether this drawdown indicated a fundamental change involved an analysis of price reaction from previous market corrections. The most recent correction started in December 2015 and lasted through February 2016. The figure below displays the annualized, risk-adjusted returns most recently observed and during the correction that began last December.
In both cases, safe haven assets such as treasuries and high quality credit outperformed broad based equities and high yield credit. In isolation, this behavior may not seem significant. However, a similar pattern may increase the likelihood that fundamentals have not changed, while a diverging pattern may indicate that macroeconomic fundamentals may be evolving.
Over the next few months, macroeconomic growth data will increase in importance as investors look for clues to any growth expectation changes in the United Kingdom, the European Union, and other large developed market economies. As a percentage of world GDP, the United Kingdom, China, and the United States represent 3.8%, 13.3% and 22.3%, respectively(2). Over the long run, equity prices reflect macroeconomic growth, and any economic slowdown would likely cause equity market declines.
In December 2015 market sentiment shifted focus towards a potential slowdown in the U.S. and Chinese economies as causes for the equity market correction. Currently market sentiment has shifted again to focus on the Brexit’s impact on global growth. If markets react similarly to December 2015 based solely on a market, that is only 10% of the combined U.S and Chinese stock markets, than that would likely represent an opportunistic time to increase equity allocations.
Monitoring volatility spikes provides opportunities to rebalance portfolios given the potential for overbought or oversold conditions. For example, we analyze the one-week change in the CBOE VIX product, a measure for S&P500 options demand, and compare to the following one-week change in the S&P 500. The analysis shows that the subsequent S&P 500 one-week return tends to increase following increasingly larger volatility spikes. On Friday June 24th 2016, the VIX index increased from 19.4 to 25.8. Comparing that 6.4 unit shift to the past ten years of week-over-week changes in the VIX, that Friday’s move ranked in the 95th percentile. A volatility spike is one part of the investment process and must be combined with other fundamental data analysis to assess the expected value of any investment.
Source: Innealta capital using Bloomberg data. VIX represents the CBOE volatility index. Weekly returns from 06.30.06 to 06.24.06.
This article was written by Innealta Capital, a participant in the ETF Strategist Channel.
Footnotes:
(1) Rising Interest Rates: A Review of Domestic vs. International Equity Performance. Innealta Capital.
(2) Data as of 12/31/2014. SOURCE: Innealta Capital using data from The World Bank.
Important Information
The information provided comes from independent sources believed reliable, but accuracy is not guaranteed and has not been independently verified. The security information, portfolio management and tactical decision process are opinions of Innealta Capital (Innealta), a division of AFAM Capital, Inc. and the performance results of such recommendations are subject to risks and uncertainties. All opinions and views constitute our judgments as of the date of writing and are subject to change at any time without notice. For more information about AFAM Capital, Inc. please visit afamcapital.com. Past performance is not a guarantee of future results.
Any investment is subject to risk. Exchange traded funds (ETFs) are subject to risks similar to those of stocks, such as market risk, and investors that have their funds invested in accordance with the portfolios may experience losses. Additionally, fixed income (bond) ETFs are subject to interest rate risk which is the risk that debt securities in a portfolio will decline in value because of
increases in market interest rates. The value of an investment and the return on invested capital will fluctuate over time and, when sold or redeemed, may be worth less than its original cost. This material is not intended as and should not be used to provide investment advice and is not an offer to sell a security or a solicitation or an offer, or a recommendation, to buy a security. Investors
should consult with an investment advisor to determine the appropriate investment vehicle. Investment decisions should be made based on the investor’s specific financial needs and objectives, goals, time horizon and risk tolerance.
Sector ETFs are subject to industry concentration risk, which is the chance that stocks comprising the sector ETF will decline due to adverse developments in the respective industry. The use of leverage (borrowed capital) by an ETF increases risk. The more a fund invests in leveraged instruments, the more the leverage will magnify gains or losses on those investments. Country/Regional risk is the chance that world events such as political upheaval or natural disaster will adversely affect the value of securities issued by companies in foreign countries or regions. Emerging markets risk is that chance that stocks of companies located in emerging markets will be substantially more volatile, and substantially less liquid, than the stocks of companies located in more developed
foreign markets.
VIX FTSE refers to the FTSE 100 volatility index (measures the implied volatility of the collective 100 companies listed on the London Stock exchange with the highest market capitalization), GBPUSD ivol refers to the implied volatility of one month at-themoney British Pound/U.S. Dollar exchange rate options, and VIX SPX refers to the CBOE SPX volatility index (a measure of the
market expectations of near-term volatility conveyed by S&P 500 Index option prices). Returns and risk calculated over the selected time frame and then annualized. XLU refers to the S&P500 Utilities sector. UST 10y refers to Merrill Lynch 10-year U.S. Treasury future total return index. UST 5yr refers to Merrill Lynch 5-year U.S. Treasury futures total return index. UST 30 refers to Merrill Lynch 30-year U.S. Treasury future total return index. US IG refers to IBOXX Investment Grade index. US HY refers to IBOXX High Yield Index. US dollar refers the US Dollar Index. GSCI refers to the S&P Goldman Sachs Commodities Index. SPX refers to the S&P500 index. R2K refers to the Russell 2000 index. XLY refers to the S&P500 Consumer Discretionary sector.
The MSCI All Country World Index Ex-U.S. is a market-capitalization-weighted index designed to provide a broad measure of stock performance throughout the world, with the exception of U.S.-based companies. It includes both developed and emerging markets. The S&P 500 Index is S&P’s broad-based market index representing a sample of leading companies in leading industries. The Merrill Lynch 5-year U.S. Treasury Index measures the total return of US 5yr treasury futures. The Merrill Lynch 10-year U.S. Treasury Index measures the total return of US 10yr treasury futures. The Merrill Lynch 30-year U.S. Treasury Index measures the total return of US 30yr treasury futures. IBOXX Investment Grade Index measures the performance of U.S. dollar-denominated, investment grade corporate bonds. IBOXX High Yield Index measures the performance of U.S. dollar-denominated, high yield corporate bonds. Dow Jones U.S. Real Estate Index is a market
capitalization weighted index of real estate investment trusts and other companies that invest directly or indirectly in real estate. The U.S. Dollar Index is an index of the value of the United States dollar relative to a basket of foreign currencies. The S&P 500 Utilities sector is a capitalization weighted index composed of companies that are components of the S&P 500 and are utilities. The
Russell 2000 Index is comprised of the smallest 2000 companies in the Russell 3000 Index, representing approximately 8% of the Russell 3000 total market capitalization. The S&P 500 Consumer Discretionary sector is a capitalization weighted index composed of companies that are components of the S&P 500 and are Consumer Discretionary. The S&P GSCI Total Return
Index serves as a benchmark for the investment in the commodities market. The index weights are based on worldwide production methodology.
Securities rated below investment grade, commonly referred to as “junk bonds,” may involve greater risks than securities in higher rating categories. Junk bonds are regarded as speculative in nature, involve greater risk of default by the issuing entity, and may be subject to greater market fluctuations than higher rated fixed income securities.
Diversification does not protect against loss in declining markets.
AFAM Capital, Inc. is an Investment Adviser, registered with the Securities & Exchange Commission and notice filed in the State of California and various other states. For more information, please visit afamcapital.com. Registration as an investment advisor does not imply any certain level of skill or training. Innealta is an asset manager specializing in the active management of portfolios of ETFs. Contact your financial advisor for additional information. 225-AFAM-7/1/2016