Note: This article appears on the ETFtrends.com Strategist Channel
By Justin Sibears
Meeting income objectives continues to be a challenge as interest rates remain near all-time lows. The good news for ETF users is that there are options for enhancing yield. 216 of the 1,901 ETFs in etf.com’s database have dividend yields in excess of 4%. The bad news is that these options are so diverse that understanding which exposures to use and how to use them can be daunting.
Enter the multi-asset income ETF. Multi-asset income ETFs provide exposure to a diverse group of high-income asset classes. Sometimes these ETFs hold other ETFs, sometimes they hold individual securities, and sometimes they do a little bit of both.
Related: High Yield: Painting with a Full Palette
We are strong advocates of a multi-asset approach to supplementing portfolio income. However, multi-asset income ETFs are not set it and forget it types of allocations. They require both upfront and ongoing due diligence. When evaluating these products, we believe three reminders are in order.
Reminder #1: Yield is just a number.
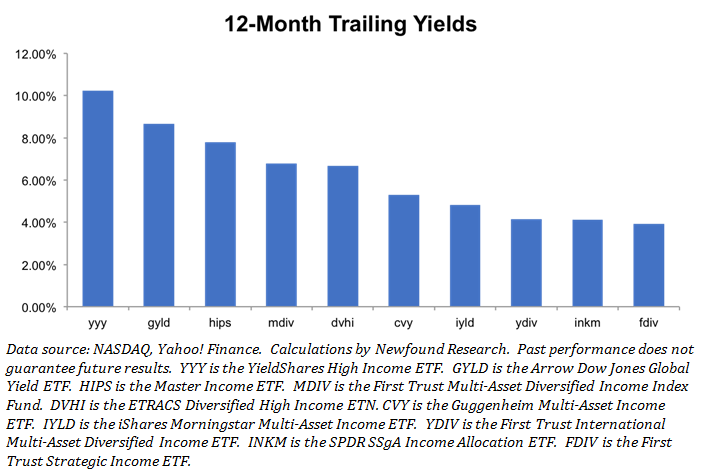
Many multi-asset income ETFs offer high yields. Below, we plot trailing 12-month yields for multi-asset income ETFs with at least one year of historical data. For reference, the Barclays Aggregate Bond Index has a trailing yield of approximately 2.3%.
Be careful not to be mesmerized by these high numbers. Yield is just one component of total return for high-income – and for that matter – all asset classes. Take high yield corporate bonds for example. Yes, beginning yield is important, but so are credit losses and fluctuations in interest rates and credit spreads.
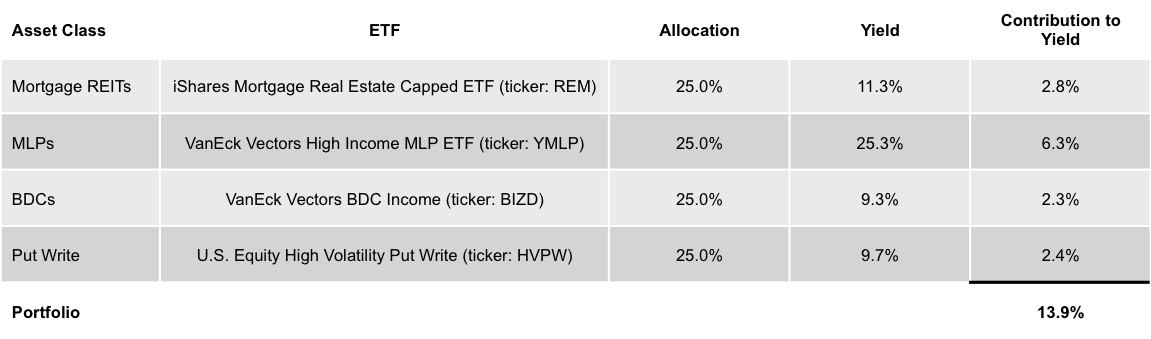
Constructing a portfolio with a high yield is a trivial exercise. Just equal weight mortgage REITs, high yielding MLPs, business development companies, and a put write strategy. Voila! We have a whopping 12-month yield of 13.9%.
Building a strategy with high stated yield is easy. Building a strategy with a high yield, attractive total return, and desirable risk characteristics is much, much more difficult.
For example, an investor who held our naïve high yield portfolio would have had suffered a 34.4% maximum drawdown in the 12 month period ending on 4/30/16. The SPDR S&P 500 ETF (SPY), on the other hand only had a drawdown of 13.0%. Year-to-date, the income strategy had a 16.8% drawdown compared to 10.3% for SPY.
Reminder #2: Look under the hood.
In a perfect world, multi-asset income ETFs would remove the need for investors to consider the merits of each and every high-income asset class. Alas, the world isn’t perfect.
When it comes to the multi-asset income offerings on the market today, the investment universe is often more important than a robust investment process.
We see below that investment universes vary considerably from one ETF to the next.
There is not a single exposure that is shared across all ten ETFs that we considered. The most common exposures are U.S. and international equities (most often with a bent towards dividend stocks), U.S. REITs, preferreds, MLPs, and high yield bonds.
Convertible bonds, TIPS, bank loans, and mortgage-backed/asset-backed securities only make an appearance in one ETF each. We find this surprising since each of these exposures offer unique structural characteristics that make them very useful diversifiers.
But apparently the term “multi-asset” does not always mean “diversified”.
Related: Most Hated Bull Market in History: Something’s Gotta Give
Unsurprisingly, large differences in each ETF’s investment universe create similar disparities in risk and return metrics. For the year-ended April 2016:
- Return ranged from -17.6% (GYLD) to +1.5% (FDIV)
- Annualized volatility ranged from 8.2% (IYLD) to 22.8% (GYLD)
- Maximum drawdown ranged from 10.8% (INKM) to 37.8% (GYLD)
- Correlation to the SPRD S&P 500 ETF (ticker: SPY) ranged from 0.51 (DVHI) to 0.94 (INKM)
- Correlation to the iShares Barclays Aggregate Bond ETF (AGG) ranged from 0.11 (DVHI) to 0.48 (IYLD)
Reminder #3: Beware static approaches.
Investors looking for a one-stop, managed solution to increase overall portfolio yield should be wary of multi-asset income ETFs with a static allocation approach.
The optimal path towards achieving a given income objective will vary considerably over time.
Take MLPs as an example. At their peak in August 2014, MLPs were yielding 4.3%, the same yield offered by long-term investment grade corporate bonds. Fast-forward to February 2016 and the yield on MLPs had skyrocketed to 11.0% while corporate yields only increased modestly to 4.3%.
When the risk/reward trade-off for a given asset class changes this dramatically, it certainly is worth reconsidering the sizing of that position. MLPs at a 4% yield are a totally different animal than MLPs at an 11% yield. Static processes, without the ability to adjust position sizes, do not afford themselves the ability to take advantage of evolving yield and risk dynamics.
Justin Sibears is the Managing Director, Portfolio Manager at Newfound Research, a participant in the ETF Strategist Channel.