
Note: This article appears on the ETFtrends.com Strategist Channel
By Corey Hoffstein
It’s been a good run – nobody can deny that. For being the most hated bull market in history, performance has been stellar on both an absolute and risk-adjusted basis.
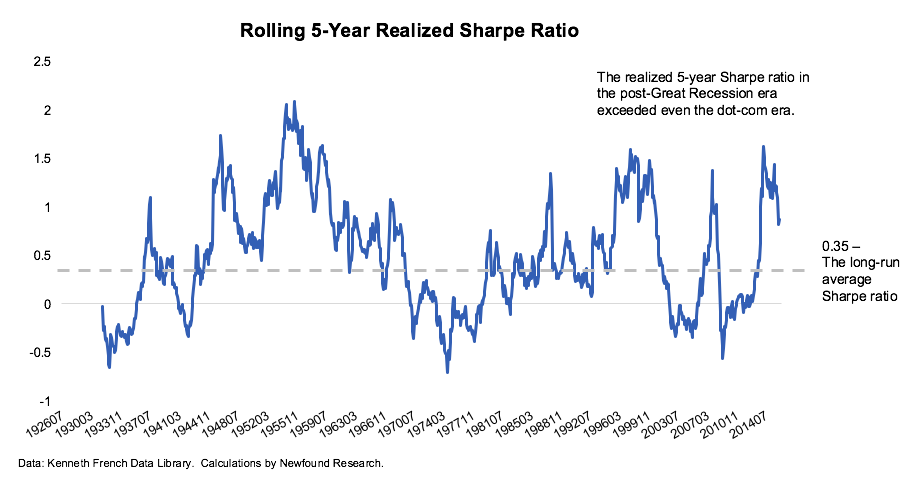
How good? Consider this: the 5-year realized Sharpe ratio of the S&P 500 peaked in 2014 at a level higher than what it achieved during dot-com mania.
That’s how good.
This performance, however, also paints a potentially worrying picture: despite over a year of sideways market action, the 5-year realized Sharpe ratio still sits well above its long-term average. The last two times the risk-adjusted return hit these levels, we saw the dot-com crash and the Great Recession.
Mind the Gap
If we break down this risk-adjusted return into its two components – excess return and volatility – we can get a sense of what is driving the elevated level we are seeing.
The answer, unfortunately, does not bring much comfort.
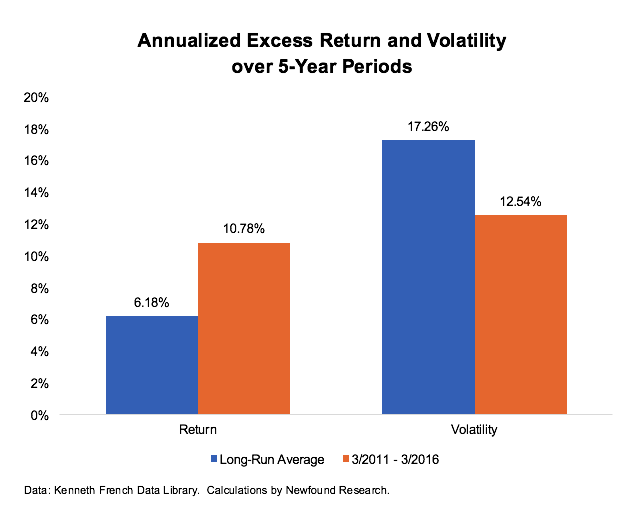
We can see that the annualized 5-year return is 4.60% above its long-term average and volatility is -4.72% below its average over the same period.
This has not been simply case of just volatility being lower or returns being higher: we’ve been living in a world of higher returns with less risk.
Consider that for returns to stay at this elevated level, volatility would have to climb to over 30% to bring our Sharpe ratio back in line with the historical average.
On the other hand, for volatility to stay suppressed, we would have to see annualized returns fall to 4.5% to fall back in line with the historical Sharpe ratio.
