
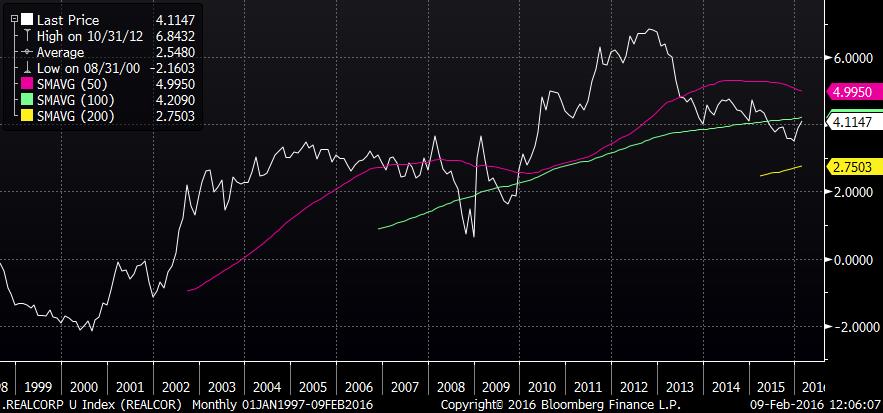
The chart below shows the spread, in real terms, between A-rated Industrial Bonds and the Earnings Yield on the S&P 500 Index. The extreme values observed were -2.16% in August of 2000 and + 6.84% in October 2012. We are currently at + 4.11%. This chart only goes back to 1998 since it uses TIPS prices to determine the forward-looking real yield.
While the above models are versions of the so-called “Fed Model”, which in its original form relates the earnings yield to the nominal yield on Treasury Bonds, the key distinction in both examples is the use of Corporate Bonds instead of Treasuries. This allows us to think about the spread as the cost of alternative forms of capital from the corporation’s perspective. Imagine that you are the CFO of a large corporation with a single-A rating and faced with the possibility of issuing debt to buy back stock in your company. If the P/E on your stock is, say 15, the corresponding earnings yield would be 1/15 or 6.67%. Since this is an after-tax number, it corresponds to roughly 10% before tax. Since interest is tax deductible this is the earnings yield that should be compared to the marginal cost of debt financing, which would be roughly 3.1%. In other words, there is a 690 basis point arbitrage gain, in nominal pre-tax terms, from issuing debt to purchase outstanding stock. In real terms, the spread is even wider, since earnings are likely to follow inflation while the Interest on the bonds is fixed. This goes a long way towards explaining why corporations are issuing debt to buy back their own shares.
So in conclusion, taking current low bond yields into account, the Equity market does not appear to be overvalued. Rather, it looks to offer a significant yield cushion versus the corporate bond market.
Jan Erik Wärneryd is a Senior Portfolio Manager at Hillswick Asset Management, a participant in the ETF Strategist Channel.
