
If recent history is any guide, we should at least consider the possibility that the terminal rate will approach the nominal GDP growth rate, which currently is running around 3.1%.
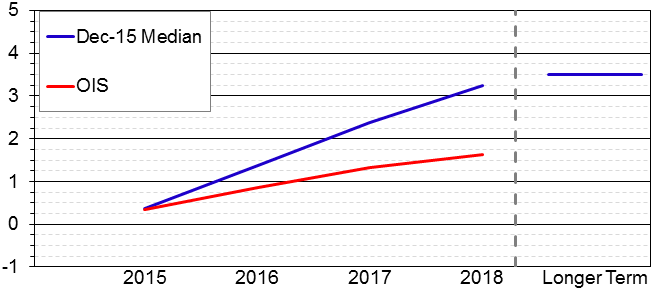
Further guidance can be had by looking at what the Federal Open Market Committee (the committee that sets the Fed Funds rate) members themselves are saying about the longer-term outlook for rates. Four times per year, FOMC members provide forecasts for rates which are summarized in a chart known as the “The FED Dot Plot”. On December 16 2015 we received the latest update, which can be seen in the chart below.
(Chart courtesy of Bloomberg)
The Blue line represents the median of the FOMC member’s own forecasts and the Red line is what the market is expecting – OIS stands for Overnight Index Swaps and is a way to trade the future FED Funds rate.
It is interesting to note that the market (the Red line) has a far more benign outlook for rate hikes than either history or the FED’s own predictions (the Blue line)would suggest. Not only does the market think that the FED will hike at a much slower pace than they themselves currently predict, but the terminal rate looks to be close to 2%. The longer term median rate according to the FOMC is at 3.5% – not that far from current nominal GDP growth and therefore consistent with recent history of FED tightening campaigns.
It remains to be seen whether the market or the FED will turn out to be “right” about the path of interest rates, but what is clear is that market participants aren’t particularly worried about the recent change in FED policy.
Jan Erik Warneryd is the Senior Portfolio Analyst at Hillswick Asset Management, a participant in the ETF Strategist Channel.
