By Gary Stringer, Kim Escue and Chad Keller, Stringer Asset Management
Developing capital market expectations is a crucial component of Stringer Asset Management’s investment philosophy. While we use several different inputs in developing these forward-looking expectations, we think that valuations can be an accurate and intuitive way to forecast future stock market performance.
Simply put, the less we pay for an asset, the more we expect to get out of it relative to history. However, it is important to remember that valuations are only applicable to gauging the stock market environment when coupled with long time horizons. Basically, expensive stocks can remain expensive for multiple years, while cheap stocks can remain cheap for many years. Therefore, when considering forecasts based on equity market valuations, we prefer to look out at least three years.
The earnings yield is one of the more impactful valuation data points that we use in developing our expectations. The basic form of the earnings yield is defined as the earnings per share divided by the current stock price. It is also the inverse of the price-to-earnings ratio. We can compare the earnings yield of a broad index, such as the S&P 500 Index, to other yields and its own history, to get a sense of how we stack up today through relative valuations.
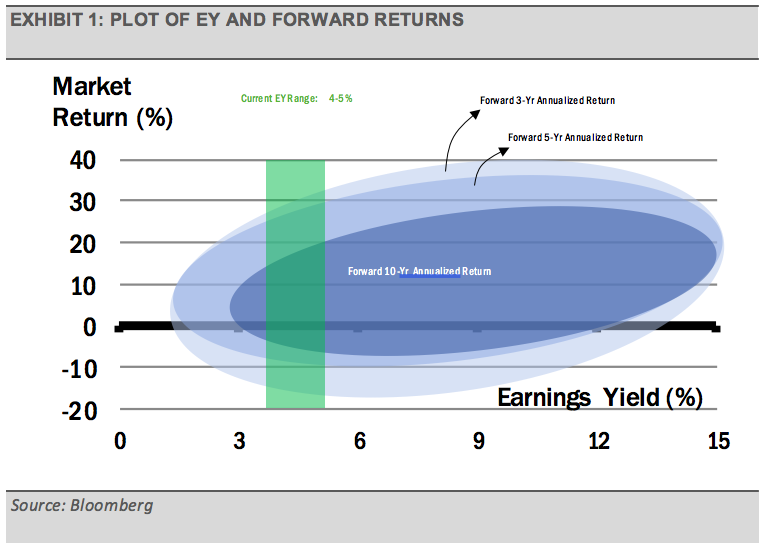
By plotting the earnings yield and the subsequent performance of the S&P 500 Index, we can see a relationship between the variables. Conceptually, we are gauging how the earnings yield relates to market returns over various timeframes. As you can see from the chart below, the relationship becomes more pronounced as the timeframe increases. Valuations are not a strong indicator of expected equity market performance over a short timeframe, but valuations can be a significant indicator over the long-term. Therefore, analyzing the market by this manner must be done with a long-term outlook.

As you would imagine, the higher the earnings yield, the greater the probability the market will achieve higher returns over the next several years. For example, the earnings yield in April 1980 was 14.37% and the S&P 500 Index returned 16.89% annualized for the next decade. At the current earnings yield range of 4-5%, the average forward ten-year annualized return of the S&P 500 Index has been around 7.83%.

