
Thought to Ponder…
“For now, Americans are anything but united. A report from the Pew Research Center published in October 2019 offered grim conclusions. Some 78 percent of Americans polled said divisions between Republicans and Democrats were increasing. Just 6 percent said they were decreasing. A majority (55 percent) said there’s a “great deal” of difference in what the two major parties stand for, up from about one-third in the mid-2000s. A startling 73 percent said that Democratic and Republican voters disagree not only on policy but on “basic facts” concerning what’s happening in the country and the world. Just 17 percent of Republicans said Democrats had at least some “good ideas,” and 13 percent of Democrats said the same of Republicans. That was before the election of 2020, Donald Trump’s refusal to concede defeat, and a deadly insurrection at the US Capitol.
Ian Bremmer
The Power of Crisis
The View From 30,000 Feet
Jitters about a systemic banking crisis have begun to ease as recent data has shown less reliance on emergency lending facilities set up in the wake of March’s banking turmoil. For the time being, the Fed looks to have successfully divorced financial stability concerns from their inflation and growth mandates. The key questions going forward will be centered around how long it will take for the rapid pace of rate increases, restrictive level of policy and now, the anticipated tightening of lending standards from banks to impact inflation and the economy, and if the vortex these forces create can be contained to an orderly soft landing? Data in the coming weeks will begin providing glimpses into consumer and business confidence, as they nervously watched the banking crisis from the sidelines. As the data rolls in investors will be wise to remember that much of the survey data did not entirely capture the full picture because many of the data collection periods straddled the period covering the banking crisis.
- ISM Manufacturing and Services surveys surprise deeply to the downside
- Jobs week offers hope that the Fed can have its cake and eat it too, but bottom line is the labor market is still too hot for comfort
- Central bank policy around the world begins transition from hiking to pause
- The most Frequently Asked Question from client’s this week: If central bank rates are peaking, should I buy equities now?
ISM Manufacturing and Services Surveys Surprise Deeply to the Downside
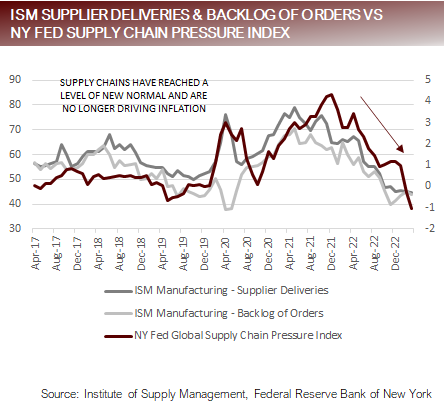
- Both the ISM Manufacturing and Services surveys surprised on the downside, but the biggest surprises were beneath the surface in the components that provide leading indicators, such as New Orders.
- Manufacturing New Orders fell to 3, marking the 9thconsecutive month of contraction. Dating back to 1960 in all but one instance, 1995/1996, when New Orders fell for 8-months or more the economy slipped into recession.
- In the latest Manufacturing survey, all components were below 50 for the first time since 2009.
- In the latest Services survey, the Prices component dropped to below 60 for the first time since September of 2020 (after peaking at an all-time high of 5 in December 2021) and is now inline with Prices for the 3 years prior to the pandemic. The New Orders component dropped a massive -10.4 to 52.2, the third largest monthly decline in the survey’s history. The New Exports Orders had its largest monthly decline in the history of the survey.
- Since July 1997, the inception of the Services Survey, there has been at total of 309 Looking at the combined total of the New Orders components of Manufacturing and Services:
- When the total measurement was in the bottom 5% the average S&P500 monthly return for the month was -1.1%.
- When the total measurement was in the top 5% the average S&P500 monthly return for the month was +2.9%.
- There is a strong relationship between ISM New Orders and equity market performance.
The Relationship Between New Orders and Equity Performance and Supply Chains Heal

Jobs Week Offers Hope That the Fed Can Have Its Cake and Eat It Too, but Still Too Hot for Comfort
- Labor Week: JOLTS, Challenger Layoffs, Jobless Claims and Unemployment
- JOLTS
- The headline JOLTS Survey moved in the Fed’s direction, dropping from 6m to 9.9m, falling 632k, bringing the drop in job openings down 2.1m in the last 11 months and reaching its lowest level since May of 2021.
- However, the labor market still remains robust, with the Quits Rate actually rising from 5% to 2.6%.
- Challenger Job Cut Announcements
- Increased 87,703, 319% year-over-year, bringing 2023’s total layoff to 270,416. Technology and Financials continue to be the industries experiencing the heaviest layoffs.
- Jobless Claims
- The Department of Labor implemented a seasonal adjustment that had the net effect of driving Jobless Claims higher.
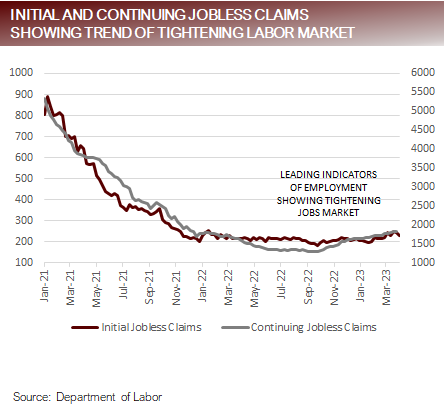
- Based on the latest seasonal adjustments, Initial Jobless Claims bottomed in mid-January and have been steadily climbing higher, with 3-week average now over 240k for 3 months, something not seen since late 2021, and higher than the average of the 2 years prior to the pandemic where the 3-week average Initial Jobless Claims average 219k.
- Unemployment
- The Change in Nonfarm Payrolls came at 236k, marginally higher than the 230k survey estimate.
- The Unemployment Rate edged slightly lower to 5% from 3.6%, driven by an uptick in labor participation, which now stands at 62.6%,the highest level since prior to the pandemic.
- Temp Workers and Over-Time Hours, which tend to lead Unemployment are both indicating future weakness.
- JOLTS
- Bottom line
- Less job openings, increased layoffs, an uptick in Initial Jobless claims are all good leading indicators that the labor markets are tightening, but coincident and lagging indicators of Nonfarm Payrolls and the Unemployment Rate continue show relics of strength that will likely keep the Fed on guard as long as inflation remains elevated.
Jobless Claims (Leading Indicator) Trending Higher, Participation Fully Recovered in Prime Aged Workers

Central Bank Policy Around the World Begins Transition From Hiking to Pause
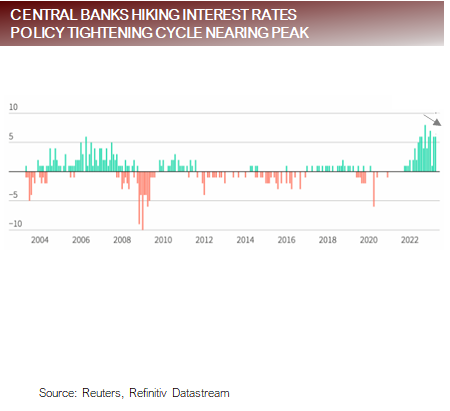
- During the month of March six developed markets central banks met and raised rates (Australia, Switzerland, Norway, Britain, United States and Europe).
- Two developed market central banks indicated that they would be pausing rate hikes (Australia, Canada).
- During the month of March 14 emerging markets central banks met, with only five choosing to hike rates (Mexico, Thailand, Philippines, Columbia and South Africa).
- Nine emerging market central banks are now on hold.
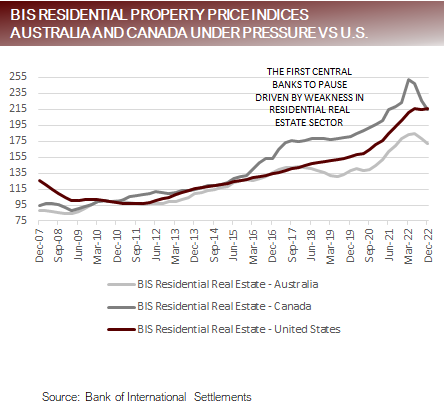
- The key factor driving a pause in developed markets is pronounced weakness in their residential real estate sectors, putting consumers under pressure.
- The United States residential real estate sector may prove to be more resilient:
- Between 2020 and 2022 less than 5% of mortgages underwritten were for adjustable rates, and between 2010 and 2020 less than 10% of mortgages underwritten were for adjustable rates.
- According to Goldman Sachs, 99% of residential owners have mortgage rates lower than 6%, with 72% of people locked below 4%.
- According to Black Knight, S. residential real estate owners are sitting on over $9t of tappable equity, over 4x during the GFC.
- The strength in the S. residential real estate markets provides the Fed more runway to raise rates or pause for longer than countries with more pronounced residential real estate problems.
- The largest danger in real estate in the S. lies in commercial real estate sector, where a wall of refinancing threatens business models. Because the likely loser for commercial real estate is the institutional owner, the Fed and policy makers will face less populist pressure to respond unless downside developments overflow into the banking system.
Policy Tightening Cycle Winding Down With Countries With Residential Real Estate Stress Leading
FAQ: If Central Bank Rates Are Peaking, Should I Buy Equities Now?
- Ultimately the answer to this question depends if you’re a trader or an investor.
- First, the good news: History indicates that the short-term equity market reaction to a pause and subsequent cut in rates is higher equity markets, which we’ve seen in 2023.
- Now, the bad news: The intermediate-term history suggest that equity markets make new lows during the downturn that follows rate cuts.
- Last week we published research highlighting in the periods leading up to and following rate cuts (looking at 20-day increments from -100 days to +100 day within rate cuts), the markets generally moved higher over the last 7 rate cutting cycles in the immediate periods surrounding the policy However, in 100% of instances the market troughed after the rate cuts began, in an average of 285 days and with an average trough of nearly 20% lower then when rate cuts began.
- Investors should keep in mind that over the last 7 recessions, the market has never troughed before the economy entered the A recession is widely expected but has not started yet. There is no denying that this time could be different, but investing based on probabilities, optimism about the rally being sustained should be balanced with the awareness that probabilities are not favorable for the upside momentum to continue.
- This year’s market rally has been led by the largest tech Investors should be aware that Information Technology is currently trading with a Forward P/E that is 11% greater than its 5-year average and 30% greater than its 10-year average. It would be very unusual for a substantial rally to take place while earnings are falling and multiple are already rich.
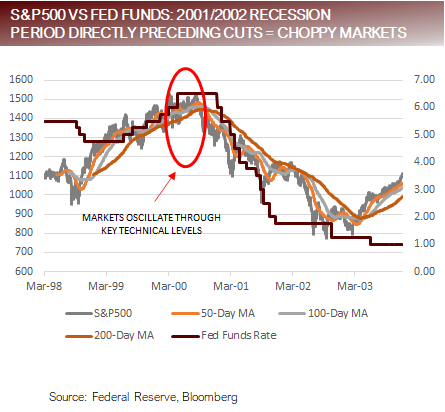
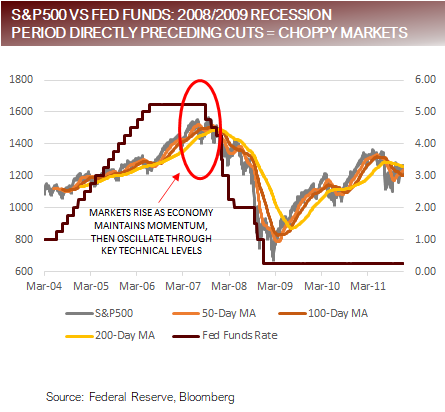
- The other interesting pattern to be aware of is that the equity markets historically enter a period of technical and narrative chop around the period of a pause and the first rate This is driven shifts in market psychology as investors are manically driven between bipolar views of expectations of a recovery and fear of a recession. Sound familiar?
Equity Market Experience “Technical and Narrative Chop” Preceding the First Rate Cut
Putting It All Together
- As central banks transition from a chorus of hike, hike, hike, to pausing and ultimately cutting rates, investor psychology will flip-flop between hope and fear as the narrative shifts between “bad news is good news,” because it means easier policy and “bad new is bad news,” because it means the economy is sinking into the abyss.
- The dynamic around the pause/cut part of the rate cycle is associated with “technical and narrative chop” as we’ve seen this year with the S&P500 bouncing on either side of its 200-day moving average, seemingly caught in a narrow trading range.
- The markets will eventually break out of the trading range of 3,800 – 4,200. Investors should remain cautious because the most probable breakout is to the downside, driven by falling earnings and rich valuations which has created stiff levels of resistance above.
- There is growing evidence that the labor market is loosening but further slack could prove to be elusive because prime age workers are already participating above pre-pandemic The majority of the deficit in the workforce appears to be made up of the 55+ demographic that may have permanently exited the workforce.
- The bottom line is that rates have risen rapidly and are The pace of rate hikes and restrictive end point has created stress in the system that may lead to systematic risks when hidden fault lines are uncovered and will ultimately lead to slower, and possibly negative, growth. Although markets may experience positive bouts of optimism, on balance, high rates on hold is a not positive development. Investors should remain cautious and skeptical of rallies into falling earnings while policy is restrictive.
Originally published by Focus Point on April 10, 2023.
For more news, information, and analysis, visit the Volatility Resource Channel.
DISCLOSURES AND IMPORTANT RISK INFORMATION
Performance data quoted represents past performance, which is not a guarantee of future results. No representation is made that a client will, or is likely to, achieve positive returns, avoid losses, or experience returns similar to those shown or experienced in the past.
Focus Point LMI LLC
For more information, please visit www.focuspointlmi.com or contact us at [email protected] Copyright 2023, Focus Point LMI LLC. All rights reserved.
The text, images and other materials contained or displayed on any Focus Point LMI LLC Inc. product, service, report, e-mail or web site are proprietary to Focus Point LMI LLC Inc. and constitute valuable intellectual property and copyright. No material from any part of any Focus Point LMI LLC Inc. website may be downloaded, transmitted, broadcast, transferred, assigned, reproduced or in any other way used or otherwise disseminated in any form to any person or entity, without the explicit written consent of Focus Point LMI LLC Inc. All unauthorized reproduction or other use of material from Focus Point LMI LLC Inc. shall be deemed willful infringement(s) of Focus Point LMI LLC Inc. copyright and other proprietary and intellectual property rights, including but not limited to, rights of privacy. Focus Point LMI LLC Inc. expressly reserves all rights in connection with its intellectual property, including without limitation the right to block the transfer of its products and services and/or to track usage thereof, through electronic tracking technology, and all other lawful means, now known or hereafter devised. Focus Point LMI LLC Inc. reserves the right, without further notice, to pursue to the fullest extent allowed by the law any and all criminal and civil remedies for the violation of its rights.
All unauthorized use of material shall be deemed willful infringement of Focus Point LMI LLC Inc. copyright and other proprietary and intellectual property rights. While Focus Point LMI LLC will use its reasonable best efforts to provide accurate and informative Information Services to Subscriber, Focus Point LMI LLC but cannot guarantee the accuracy, relevance and/or completeness of the Information Services, or other information used in connection therewith. Focus Point LMI LLC, its affiliates, shareholders, directors, officers, and employees shall have no liability, contingent or otherwise, for any claims or damages arising in connection with (i) the use by Subscriber of the Information Services and/or (ii) any errors, omissions or inaccuracies in the Information Services. The Information Services are provided for the benefit of the Subscriber. It is not to be used or otherwise relied on by any other person. Some of the data contained in this publication may have been obtained from The Federal Reserve, Bloomberg Barclays Indices; Bloomberg Finance L.P.; CBRE Inc.; IHS Markit; MSCI Inc. Neither MSCI Inc. nor any other party involved in or related to compiling, computing or creating the MSCI Inc. data makes any express or implied warranties or representations with respect to such data (or the results to be obtained by the use thereof), and all such parties hereby expressly disclaim all warranties of originality, accuracy, completeness, merchantability or fitness for a particular purpose with respect to any of such data. Such party, its affiliates and suppliers (“Content Providers”) do not guarantee the accuracy, adequacy, completeness, timeliness or availability of any Content and are not responsible for any errors or omissions (negligent or otherwise), regardless of the cause, or for the results obtained from the use of such Content. In no event shall Content Providers be liable for any damages, costs, expenses, legal fees, or losses (including lost income or lost profit and opportunity costs) in connection with any use of the Content. A reference to a particular investment or security, a rating or any observation concerning an investment that is part of the Content is not a recommendation to buy, sell or hold such investment or security, does not address the suitability of an investment or security and should not be relied on as investment advice.
Important Disclosures
This communication reflects our analysts’ current opinions and may be updated as views or information change. Past results do not guarantee future performance. Business and market conditions, laws, regulations, and other factors affecting performance all change over time, which could change the status of the information in this publication. Using any graph, chart, formula, model, or other device to assist in making investment decisions presents many difficulties and their effectiveness has significant limitations, including that prior patterns may not repeat themselves and market participants using such devices can impact the market in a way that changes their effectiveness. Focus Point LMI LLC believes no individual graph, chart, formula, model, or other device should be used as the sole basis for any investment decision. Focus Point LMI LLC or its affiliated companies or their respective shareholders, directors, officers and/or employees, may have long or short positions in the securities discussed herein and may purchase or sell such securities without notice. Neither Focus Point LMI LLC nor the author is rendering investment, tax, or legal advice, nor offering individualized advice tailored to any specific portfolio or to any individual’s particular suitability or needs. Investors should seek professional investment, tax, legal, and accounting advice prior to making investment decisions. Focus Point LMI LLC’s publications do not constitute an offer to sell any security, nor a solicitation of an offer to buy any security. They are designed to provide information, data and analysis believed to be accurate, but they are not guaranteed and are provided “as is” without warranty of any kind, either express or implied.
FOCUS POINT LMI LLC DISCLAIMS ANY AND ALL EXPRESS OR IMPLIED WARRANTIES, INCLUDING, BUT NOT LIMITED TO, ANY WARRANTIES OF MERCHANTABILITY, SUITABILITY OR FITNESS FOR A PARTICULAR PURPOSE OR USE.
Focus Point LMI LLC, its affiliates, officers, or employees, and any third-party data provider shall not have any liability for any loss sustained by anyone who has relied on the information contained in any Focus Point LMI LLC publication, and they shall not be liable to any party for any direct, indirect, incidental, exemplary, compensatory, punitive, special or consequential damages, costs, expenses, legal fees, or losses (including, without limitation, lost income or lost profits and opportunity costs) in connection with any use of the information or opinions contained Focus Point LMI LLC publications even if advised of the possibility of such damages.
