
By Karen Veraa
KEY TAKEAWAYS
- Given the yields currently available in U.S. Treasuries, investors may want to revisit their fixed income allocations, potentially earning more income while simultaneously reducing portfolio risk.
- From 2013 to 2021, only emerging market and high yield debt provided yields over 4%; now, over 70% of fixed income sectors are yielding 4% or greater.1
- Many investors appear to be under-allocated to fixed income. Bond ETFs are an efficient way to reposition a traditional portfolio comprised of 60% stocks and 40% fixed income.
BONDS ARE BACK
A silver lining of 2022 — the most challenging bond market in 40 years — is that bond yields rose to levels not seen since 2007.2 Concerns about the financial sector led bond prices to rise and yields to fall in March 2023, a reminder that investors often seek out safer assets in times of stress.
But yields remain near multi-decade highs, suggesting investors can once again look to bonds for income and potential diversification benefits.
With inflation soaring and the Federal Reserve aggressively hiking rates, 2022 was the worst year for traditional 60/40 portfolios since 2008.3 Broad measures of stocks and bonds suffered annual declines in the same year for the first time since 19694, with the S&P 500 losing 18% and the Bloomberg U.S. Aggregate Bond Index down over 13%.5
BOND YIELDS: BACK TO PRE-CRISIS LEVELS
The seeds of 2022’s bond market rout were sown in the Great Financial Crisis (GFC) and its aftermath. Because the Federal Reserve left rates so low for so long after the GFC, many investors were compelled to “reach for yield” in sectors such as high yield or lower-quality securitized assets.
Investors who previously sought yields and returns by overweighting equities, going down in credit quality and liquidity now have an opportunity to earn yields above 4.0% in 2-year Treasuries as of March 15, 2023, as well as other fixed-income products.6 This is a huge shift in the investing landscape. From 2013 to 2021, only emerging market and high-yield debt provided yields over 4%; based on market values of as February 28, 2023, over 70% of fixed income sectors are yielding 4% or greater.
Figure 1: Fixed income assets with yields above 4%
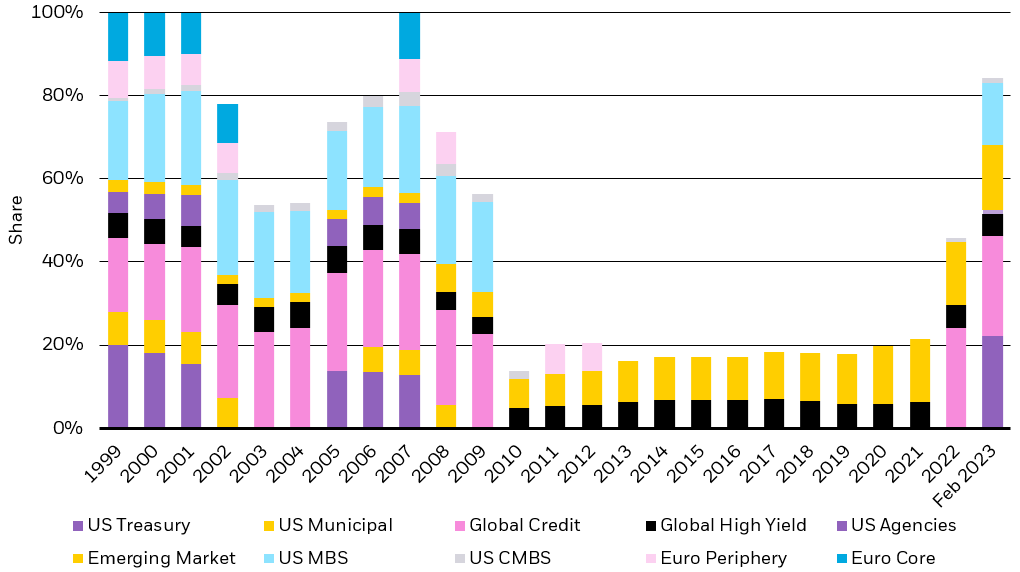
Sources: BlackRock Investment Institute, with data from Refinitiv Eikon, February 2023. Note: The bars show market capitalization weights of assets with an average annual yield over 4% in a select universe that represents about 70% of the Bloomberg Multiverse Bond Index. U.S. treasury represented by the Bloomberg U.S. Treasury index. Euro core is based on the Bloomberg French and German government debt indexes. U.S. agencies represented by Bloomberg U.S. Aggregate Agencies index. U.S. municipal represented by Bloomberg Municipal Bond index. Euro periphery is an average of the Bloomberg Government Debt indexes for Italy, Spain and Ireland. U.S. MBS represented by the Bloomberg U.S. Mortgage-Backed Securities index. Global credit represented by the Bloomberg Global Aggregate Corporate index. U.S. CMBS represented by the Bloomberg Investment Grade CMBS index. Emerging market combines the Bloomberg EM hard and local currency debt indexes. Global high yield represented by the Bloomberg Global High Yield index.
Past performance is no guarantee of future results. Index performance is shown for illustrative purposes only. You cannot invest directly in an index.
Chart description: Bar chart showing yields on various fixed income assets from 1999 – Feb. 2023.
Given the yields currently available in U.S. Treasuries, now is a great time for investors to revisit their fixed-income allocations, potentially earning more income while simultaneously reducing portfolio risk.
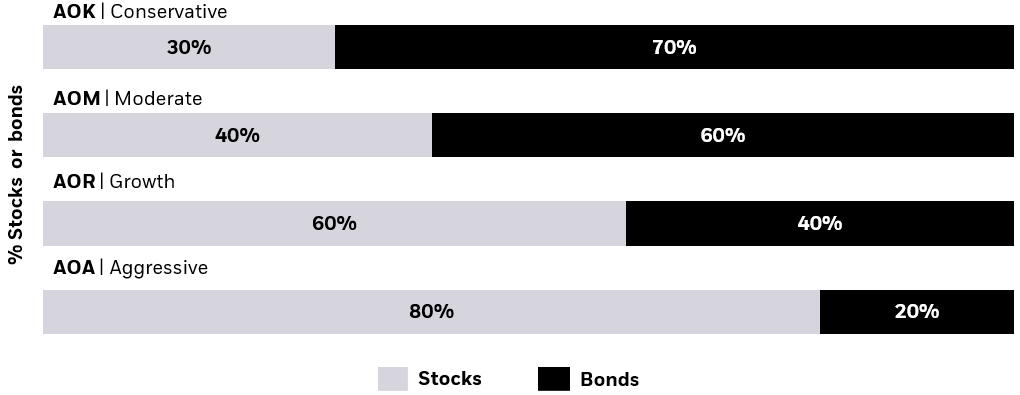
Importantly, we estimate most investors are still under-allocated to fixed income. As of February 2023, the average American’s asset allocation to fixed income was just 14.9%, according to the American Association of Individual Investors survey.7 For example iShares Core Allocation ETF series have stock and bond target allocations for four risk profiles, which are conservative, moderate, growth and aggressive. The aggressive allocation has a 20% weight to bonds. These ETFs in the Core Allocation series are designed to create a diversified core portfolio using low-cost ETFs.
Figure 2: Each ETF has a target fixed allocation to stocks and bonds
Source: BlackRock, S&P.
Chart description: Illustration of the targeted asset breakdown of the four iShares Core Allocation ETFs.
The upshot could be a once in a decade opportunity for investors — both self-directed and those working with an advisor — to reallocate assets to fixed income. In the process, many investors can seek to reduce equity over-weights, and move up in credit quality and liquidity, all while potentially reducing aggregate portfolio risk. Investors may also find opportunities for tax loss harvesting.
We believe that bond ETFs are one of the most efficient ways to “fix the 40”. Because of their transparency, low cost and liquidity, as well as breadth of offering, investors can potentially use bond ETFs to retool and customize their “40” to seek to increase income, enhance liquidity, diversify risk assets and reduce overall portfolio risk.
CONCLUSION
2022 will be remembered as the worst bond market in at least 40 years. Despite this, U.S. bond ETF inflows were approximately $200 billion and trading volumes were up nearly 40% from the prior year.8
In the face of negative returns, persistent volatility, and inflation rising at the fastest pace in over 40 years9, investors of all types turned to bond ETFs to navigate this complex market environment.
With their liquidity, efficiency and breadth of exposures, bond ETFs had record inflows and gained widespread adoption as instruments to potentially attain attractive yields and reduce risk in portfolios. And more than ever, investors turned to fixed income ETFs to pursue these goals and navigate rapidly changing market dynamics.
Although the confluence of forces shaping the bond market in 2022 may not soon be repeated, the long-term, structural drivers of bond ETF adoption remain firmly intact. This only reinforces our view that bond ETFs will continue to grow, reaching $5 trillion in assets globally by 2030 while further cementing their role as a central and important part of the bond market itself.
This article originally published on iShares.com on April 4, 2023.
For more news, information, and analysis, visit the U.S. Treasuries & TIPS Fixed Income Channel.
© 2023 BlackRock, Inc. All rights reserved.
1 Sources: BlackRock Investment Institute, with data from Refinitiv Eikon, February 2023. See Figure 1 for more information.
2 Source: Bloomberg as of 02/15/2023.
3 Source: Bloomberg as of 12/31/2022. Calculated using the blended returns of 60% S&P 500 and 40% Bloomberg US Aggregate bond index total returns annually over the past 30 years ending 12/31/2022.
4 Source: NYU Stern School of Business.
5 Source: Bloomberg as of 12/31/2022.
6 Source: Bloomberg as of 03/15/2023.
7 Source: American Association of Individual Investors as of February 2023.
8 Source: BlackRock iShares Global Business Intelligence (YTD data as of December 30, 2022).
9 Source: U.S. Bureau of Labor Statistics. For the 12 months ended June 2022, the Consumer Price Index rose 9.1%, the largest 12-month increase since November 1981.
Carefully consider the Funds’ investment objectives, risk factors, and charges and expenses before investing. This and other information can be found in the Funds’ prospectuses or, if available, the summary prospectuses, which may be obtained by visiting the iShares Fund and BlackRock Fund prospectus pages. Read the prospectus carefully before investing.
Investing involves risk, including possible loss of principal.
Fixed income risks include interest-rate and credit risk. Typically, when interest rates rise, there is a corresponding decline in the value of debt securities. Credit risk refers to the possibility that the debt issuer will not be able to make principal and interest payments.
Non-investment-grade debt securities (high-yield/junk bonds) may be subject to greater market fluctuations, risk of default or loss of income and principal than higher-rated securities.
TIPS can provide investors a hedge against inflation, as the inflation adjustment feature helps preserve the purchasing power of the investment. Because of this inflation adjustment feature, inflation protected bonds typically have lower yields than conventional fixed rate bonds and will likely decline in price during periods of deflation, which could result in losses. Government backing applies only to government issued securities, and does not apply to the funds.
An investment in the Fund is not insured or guaranteed by the Federal Deposit Insurance Corporation or any other government agency and its return and yield will fluctuate with market conditions.
There can be no assurance that an active trading market for shares of an ETF will develop or be maintained.
Investment in a fund of funds is subject to the risks and expenses of the underlying funds.
Diversification and asset allocation may not protect against market risk or loss of principal.
This material represents an assessment of the market environment as of the date indicated; is subject to change; and is not intended to be a forecast of future events or a guarantee of future results. This information should not be relied upon by the reader as research or investment advice regarding the funds or any issuer or security in particular.
The strategies discussed are strictly for illustrative and educational purposes and are not a recommendation, offer or solicitation to buy or sell any securities or to adopt any investment strategy. There is no guarantee that any strategies discussed will be effective.
The information presented does not take into consideration commissions, tax implications, or other transactions costs, which may significantly affect the economic consequences of a given strategy or investment decision.
This material contains general information only and does not take into account an individual’s financial circumstances. This information should not be relied upon as a primary basis for an investment decision. Rather, an assessment should be made as to whether the information is appropriate in individual circumstances and consideration should be given to talking to a financial professional before making an investment decision.
The information provided is not intended to be tax advice. Investors should be urged to consult their tax professionals or financial professionals for more information regarding their specific tax situations.
The Funds are distributed by BlackRock Investments, LLC (together with its affiliates, “BlackRock”).
The iShares Funds are not sponsored, endorsed, issued, sold or promoted by Bloomberg, BlackRock Index Services, LLC, Cboe Global Indices, LLC, Cohen & Steers, European Public Real Estate Association (“EPRA® ”), FTSE International Limited (“FTSE”), ICE Data Indices, LLC, NSE Indices Ltd, JPMorgan, JPX Group, London Stock Exchange Group (“LSEG”), MSCI Inc., Markit Indices Limited, Morningstar, Inc., Nasdaq, Inc., National Association of Real Estate Investment Trusts (“NAREIT”), Nikkei, Inc., Russell, S&P Dow Jones Indices LLC or STOXX Ltd. None of these companies make any representation regarding the advisability of investing in the Funds. With the exception of BlackRock Index Services, LLC, who is an affiliate, BlackRock Investments, LLC is not affiliated with the companies listed above.
Neither FTSE, LSEG, nor NAREIT makes any warranty regarding the FTSE Nareit Equity REITS Index, FTSE Nareit All Residential Capped Index or FTSE Nareit All Mortgage Capped Index. Neither FTSE, EPRA, LSEG, nor NAREIT makes any warranty regarding the FTSE EPRA Nareit Developed ex-U.S. Index, FTSE EPRA Nareit Developed Green Target Index or FTSE EPRA Nareit Global REITs Index. “FTSE®” is a trademark of London Stock Exchange Group companies and is used by FTSE under license.
©2023 BlackRock, Inc or its affiliates. All Rights Reserved. BLACKROCK, iSHARES, iBONDS, ALADDIN and the iShares Core Graphic are trademarks of BlackRock, Inc. or its affiliates. All other trademarks are those of their respective owners.
iCRMH0323U/S-2763736
