
“E. L. Doctorow once said that ‘writing a novel is like driving a car at night. You can see only as far as your headlights, but you can make the whole trip that way.’ You don’t have to see where you’re going, you don’t have to see your destination or everything you will pass along the way. You just have to see two or three feet ahead of you. This is right up there with the best advice about writing, or life, I have ever heard.
— Anne Lamott, Bird by Bird
The View from 30,000 feet
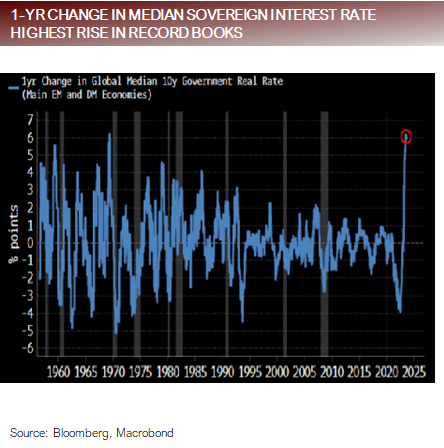
Last week the markets showed signs of coming to terms with the poor secular picture for sovereign debt. Catalyzed by fears of a government shutdown, looming issuances to cover swelling deficit spending and intense rhetoric about the need for higher rates from the Fed, the bond market buckled, and according to Bloomberg, sovereign yields experienced their sharpest one week rise in 60 years. In the face of rising yields, soring oil prices, concerns that retail sales will face hurdles based on increasing nervous comments from retailers and the resumption of student loan debt repayments, equites also faced a stiff headwind. A brief look back on Q3 finds that the S&P500 fell -3.3%, along with the Bloomberg Aggregate Bond Index falling -3.2%. The broader Treasury market fared worse, falling -4.2%, as did the FANGs which fell nearly -5.0%. The sole winner was commodities, which were propelled by energy prices, which most of us find a hard time calling a bright spot. Although short-term momentum is lower, the equity markets are nearing resistance levels, and as we turn the corner into reporting season the markets will have a new set of potentially positive catalysts heading into a seasonally stronger period.
- Double clicking on the recent dynamics influencing the Treasury markets
- Last year’s big call in January was recession and 2023 would be the year of the bond, looks wrong on both The echo chamber is now shouting private credit as the hot trade.
- What’s next for AI
- The most Frequently Asked Question from clients this week: What are the major trends in consumption that are driving demand in different sectors of the economy?
Double clicking on the recent dynamics influencing the Treasury markets
- Torsten Slok of Apollo provided a great note last week summarizing the potential drivers in the S. interest rate markets. Importantly, he noted the blowout in rates since July has been almost entirely driven by term premium, which may signal there is more going on than simply a repricing due to Fed interest rate expectations. He notes, possible influences he cited in his note included:
- Declining repo due to Treasury issuance on the front end to refill the TGA leading to an unwind of the basis trade.
- Slowing growth in China creates less exports to the S., and as a consequence, less excess U.S. Dollars in China that need to be recycled into Treasuries, lowering foreign demand for Treasuries.
- The result of QT is the absence of the largest buyer of Treasuries.
- The S. Budget Deficit is unusually high (6% of GDP) and requiring massive amounts of Treasury issuance.
- The recent downgrade by Fitch and new concerns raised by Moody’s call into questions the credit worthiness of S. sovereign debt given the disfunction and irresponsible spending patterns of the U.S. government.
- Japan’s move away from YCC, changing the relative dynamics of hedging costs and calculus for international investors with regards to U.S. debt and carry trades.
- There is an abundance of T-Bills outstanding and a massive need for further issuance, with the recent results of auction indication poor uptake.
- Bottom Line
- Higher rates means further losses for Treasuries, with the Bloomberg US Treasury Bond Index now down -2.99% for 2023. Treasuries are threatening to face a staggering third year of losses, calling into question the very meaning of “risk-free’ assets and shaking investor faith in the 60/40 portfolio, where fixed income is meant to “protect” the portfolio.
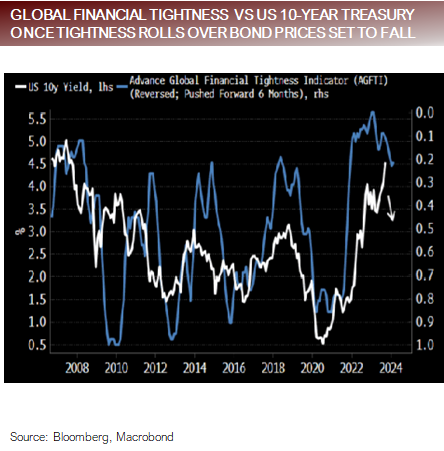
A spike of this magnitude in yields combined with a shift in policy tightness precedes mean reversion
Last year’s big year end call: Recession and comeback for bonds. 2024 is for Private Credit.
- 2022 was one of the worst year on record for S. Treasuries. By the end of the year, heavy losses in Treasuries and higher yields, left investors optimistic that 2023 would bring lower rates and a weaker equity market, that would mark a return of the negative correlation between the Stock / Bond portfolio and revive the ailing 60/40 portfolio.
- Fast forward 9 months and the markets have literally performed opposite of the consensus year end call, torturing active managers and emboldening the “set it and forget” it crowd.
- Further compounding the issue is that the broad market as represented by the Equal Weight S&P500 and Russell 2000, which together represent a more widely balanced way to measure average equity performance, are essentially flat on the In sum, a balanced 60/40, Stock / Bond is flat to down marginally on the year.
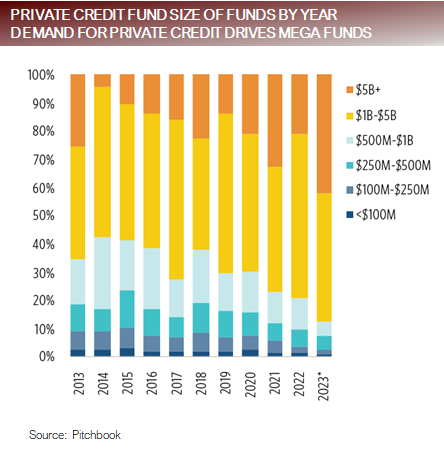
- A new darling as emerged in 2023: the Private Credit
- According to Bloomberg, Private Credit swelled from $875b in 2020 to $1.4t in 2023, and according to estimates by Prequin they are on track to $2.3t by Private Credit is on a tear to become a massive part the $13t global private capital market framework. Given that total global credit has a total value of about $130t and total global market cap of equities is about $101t, there is plenty of scope for the private markets to continue to expand, especially given the $98t in assets the banking system, which is being eroded by regulators and creating a vacuum being filled by Private Credit.
- Although there is a great case for continued expansion of Private Credit, if 2023 taught us anything, it’s that the consensus view isn’t always right.
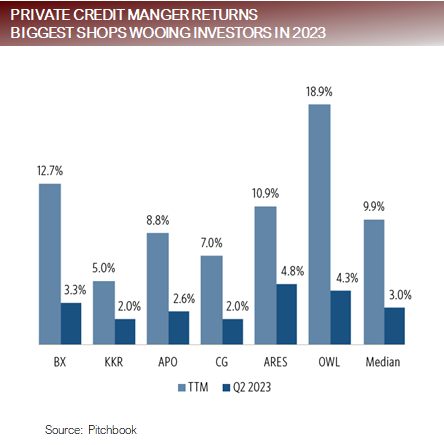
Investors are chasing the relative stability and return strength of private credit
What’s next for AI
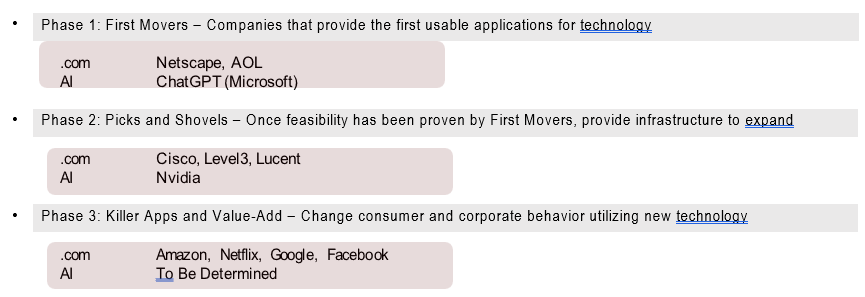
- The AI trade is currently playing out with similarly to the .com There were three distinct phases to the .com phase, that we think will repeat for the AI trade.
- Bottom Line
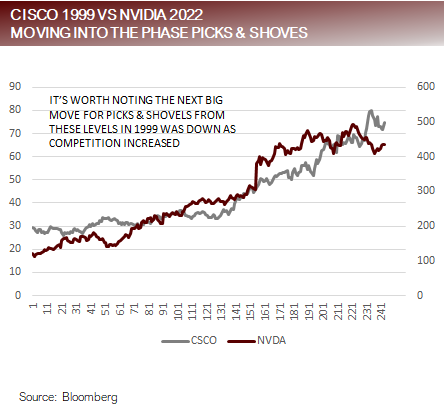
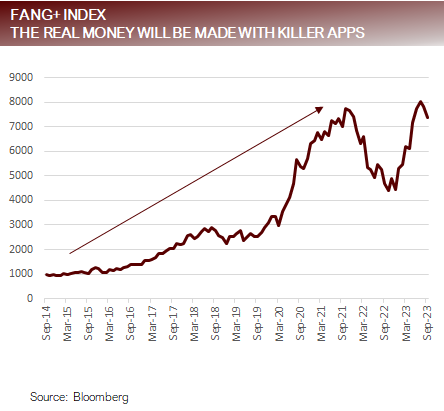
- The First Mover phase market returns were muted because massive market cap companies saw the opportunity and gobbled up the First Movers, so their relative move was diluted by the huge market cap of the The Picks and Shovels phase has just begun and will fill quickly with entrants and ultimately lead to overcapacity. Killer Apps and Value-Add is where the real excitement is because this will involve new ideas, new companies and new approaches to the way we live our lives. It’s also where the real money is made.
Following the pattern of .com’s, AI transitioning from first movers, to picks & shovels, to killer apps
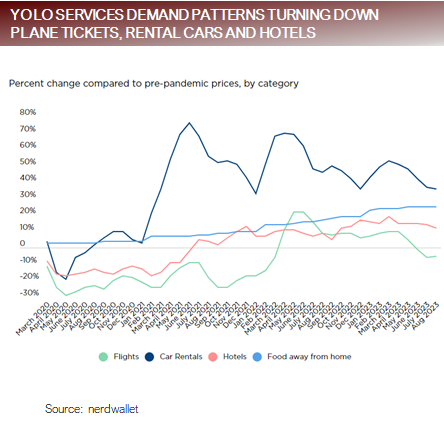
FAQ: Major trends in consumption that are driving demand in different sectors of the economy
- Post-pandemic disinflationary Forces:
- Monetary and fiscal floods of liquidity while the economy was shutdown led to a tidal wave of demand for goods, creating a sharp spike in goods prices, followed by a downdraft in goods prices as demand has normalized.
-
- As the reopening took hold with the liquidity floodgate still open consumption of goods transferred to consumption of services, with YOLO and pent-up demand for experiences unleashing consumers on the service sector. Signs are that services are now normalizing, which has begun create a downdraft in services prices.
- Post-pandemic inflationary Forces still in place:
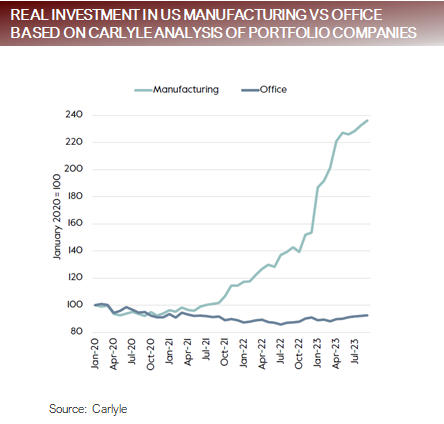
- Fiscal programs including the CHIPS Act, CARES Act and Employee Retention Act, continue to flood liquidity into sectors of the economy causing demand distortions leading to supply / demand imbalances, contributing to pockets inflation.
-
- Investment in fixed assets in industrial sectors such as chip fabrication plants, green energy and LNG facilities grew at an annualized pace of 23% in the first half of 2023.
-
- High interest rates have frozen homeowners in place in their current low-cost mortgages, driving home demand to the new home market.
-
- Residential fixed investment was up at an annualized rate of 1% in the first half of 2023, in spite of skyrocketing mortgage costs.
- The permanent accelerated retirement of aging Baby Boomers during the pandemic left a hole in the labor force that is causing a supply / demand imbalance in the workforce, despite Prime Age workers participating exceeding pre-pandemic highs.
Normalization of demand patterns mixed with distortions from excess liquidity programs
Putting it all together
- The forces that had been driving inflation are receding as demand for goods and services are working towards normalizing, but the Fed still faces challenges because fiscal liquid programs, homeowners with locked rates and changes in the composition of the workforce are still creating distortions and inflationary challenges. Powell, motivated by the ghost of Volcker, says he will err on the side of caution and has indicated he intends to overstay hawkish policy.
- On balance, this means pockets of disinflation mixed with pockets of inflation are just enough to keep the Fed overly vigilant, and the economy on locked into a trajectory of a slowdown. When a significant slowdown plays out is hard to pinpoint, with inflationary forces still skewing supply / demand dynamics.
- In the short-term, the markets will need to continue to digest the first half of the year’s overbought conditions in the AI theme, along side the growing list of concerns driven by the march higher in rates.
- Although short-term reflationary dynamics from continued fiscal spending may usher in a revival of animal spirts in the traditionally strong fourth quarter, as dominos fall due to higher rates a looming slowdown is likely to take shape.
- The good news and saving grace is that the markets are pricing out interest rate cuts, which is precisely the dynamic the Fed needs to maximize the impact of interest rate cuts when they If the markets believed there were interest rate cuts coming, they would price in the cuts, voiding their impact. It’s the surprise effect that provides for the V recovery.
For more news, information, and analysis, visit the US Treasuries and TIPS Fixed Income Channel.
