
These companies are typically younger, smaller companies which do not have a drug approved, but instead focus on testing their experimental drug candidates in human clinical trials.
The indexes for both BBP and BBC are sponsored by LifeSci Index Partners, and uses a selection committee to determine which biotech companies qualify for each index. To make the cut, companies need to meet certain size and liquidity requirements, but also need to be considered “pure” biotech companies.
This means they can not fall into one of these nine distinct sub-industries of the biotech sector: Animal Health, Conglomerate, Diversified Healthcare, Healthcare Services, Large Pharmaceuticals, Specialty Pharmaceuticals, Medical Devices, Nutraceuticals, or Tools.
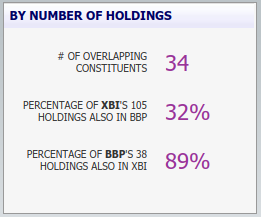
The differences in targeting criteria and market cap minimums mean that XBI and the BBP/BBC pair are not entirely similar. Currently, 78% of XBI’s components appear in either BBP or BBC.
![]()

BBP and BBC have both been around since the end of 2014, so we have 3+ years of overlapping risk/return data to work with to compare each of the funds.
The 2015-2017 time frame was especially volatile for biotechs, with the standard deviation of daily returns more than doubling that of the S&P 500. XBI, for example, was up nearly 50% during the first seven months of 2015, before plunging nearly 50% from its 2015 highs by the beginning of 2016. Putting the four biotech ETFs side by side, it becomes clearer where the returns and the risk have been coming from.
The 13% average annual return of XBI and the 2% average annual return of IBB show how the biggest biotechs have been dragging down returns.
The standard deviation of returns and max drawdown suggest that IBB has been the least volatile ETF during that time frame, but a Sharpe ratio of 0.2 also tells us it’s done with worst job of delivering risk-adjusted returns. The Sortino ratio, a measure of excess returns compared to downside risk, is also the worst of the bunch.
We can also see that the more mature biotechs have outperformed the more speculative clinical trial stage biotechs. That’s not necessarily surprising given that the market hasn’t been rewarding excess risk with excess returns (beta ETFs, such as the S&P 500 (SPY) have been outperforming both smart beta and high beta products as a whole). BBC has underperformed BBP by more than 10% annually, while experiencing a far higher degree of volatility.
As mentioned earlier, I prefer an equal-weighted biotech ETF over a market cap-weighted one, because, even though it’s historically come with about 25% higher risk, it’s also produced around 30% greater returns, resulting in higher risk-adjusted returns. Plus, the equal-weighted product makes you less reliant on the performance of just a few big names.
The reason I like the BBP/BBC pair is the flexibility it gives in adjusting your biotech exposure as you see fit. XBI maintains a steady allocation to the entire biotech sector, and since it rebalances itself every quarter, it’s never going to stray too far from its current balance of product stage/clinical trial stage companies. Using BBP and BBC allows you to tilt your portfolio based on current conditions within the sector.
Conclusion
For the record, I think XBI is a good option for biotech investors. Its expense ratio of just 0.35% is the cheapest in the space and less than half that of the 0.79% expense ratios of BBP and BBC. So I don’t think there’s anything wrong with using XBI.
More frequent traders and those who study the biotech sector more closely may appreciate the flexibility of overweighting specific types of companies within the sector depending on their own research. In that case, using BBP and BBC in lieu of a product, such as XBI, makes sense. Whichever option you choose, I think both make more sense than going with IBB.
This article has been republished with permission by Dave Dierking.