With the Dow tumbling more than 800 points on Wednesday as Treasury yields tick higher, it’s easy for investors to get caught in seeing red and causing them to sell off investments in a frenzied environment.
However, when looking at a moving average, a technical indicator that aims to smooth out the price of an investment by filtering out the market noise from volatility, it reveals that the Dow is not in as much turmoil as the news purports.
The moving average, known as a lagging indicator because it focuses on past prices to identify a trend, is showing an upward trajectory. In particular, the 200-day moving average, represented in the purple line in the graph below, shows that the Dow is moving above the average despite all the gloom and doom in the latest market news.
![]()

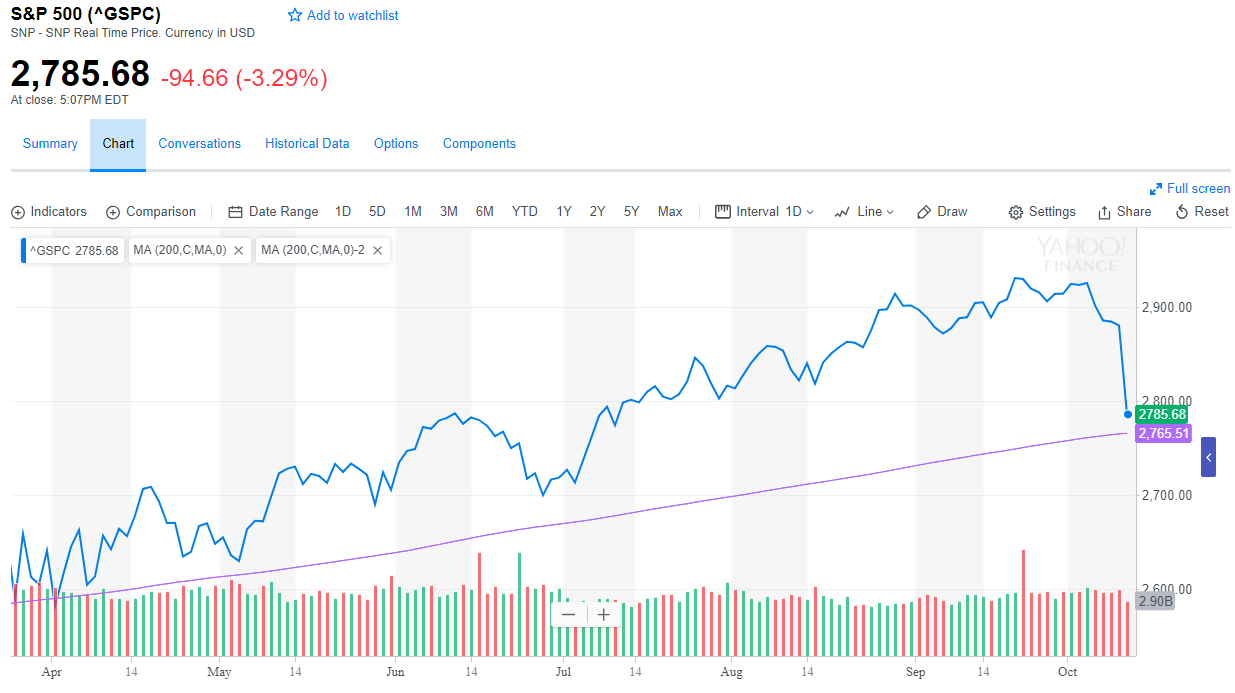
A closer look at the S&P 500 below also shows that is currently above its moving average as well, but worry could ensue if it does break below the moving average.
![]()
What’s Driving The Market Selloff?
Earlier this week, the International Monetary Fund cut its outlook for growth in the global economy to 3.7 percent from 3.9 percent, partly because of worsening trade tensions between the U.S. and China.
