by Jennifer Nash of VettaFi | Advisor Perspectives, 12/29/23
As 2023 comes to an end, let’s revisit the top 10 most-read charts of the year. From wage trends to market valuations and economic indicators, these charts provided insight into the economic landscape that shaped the past year.
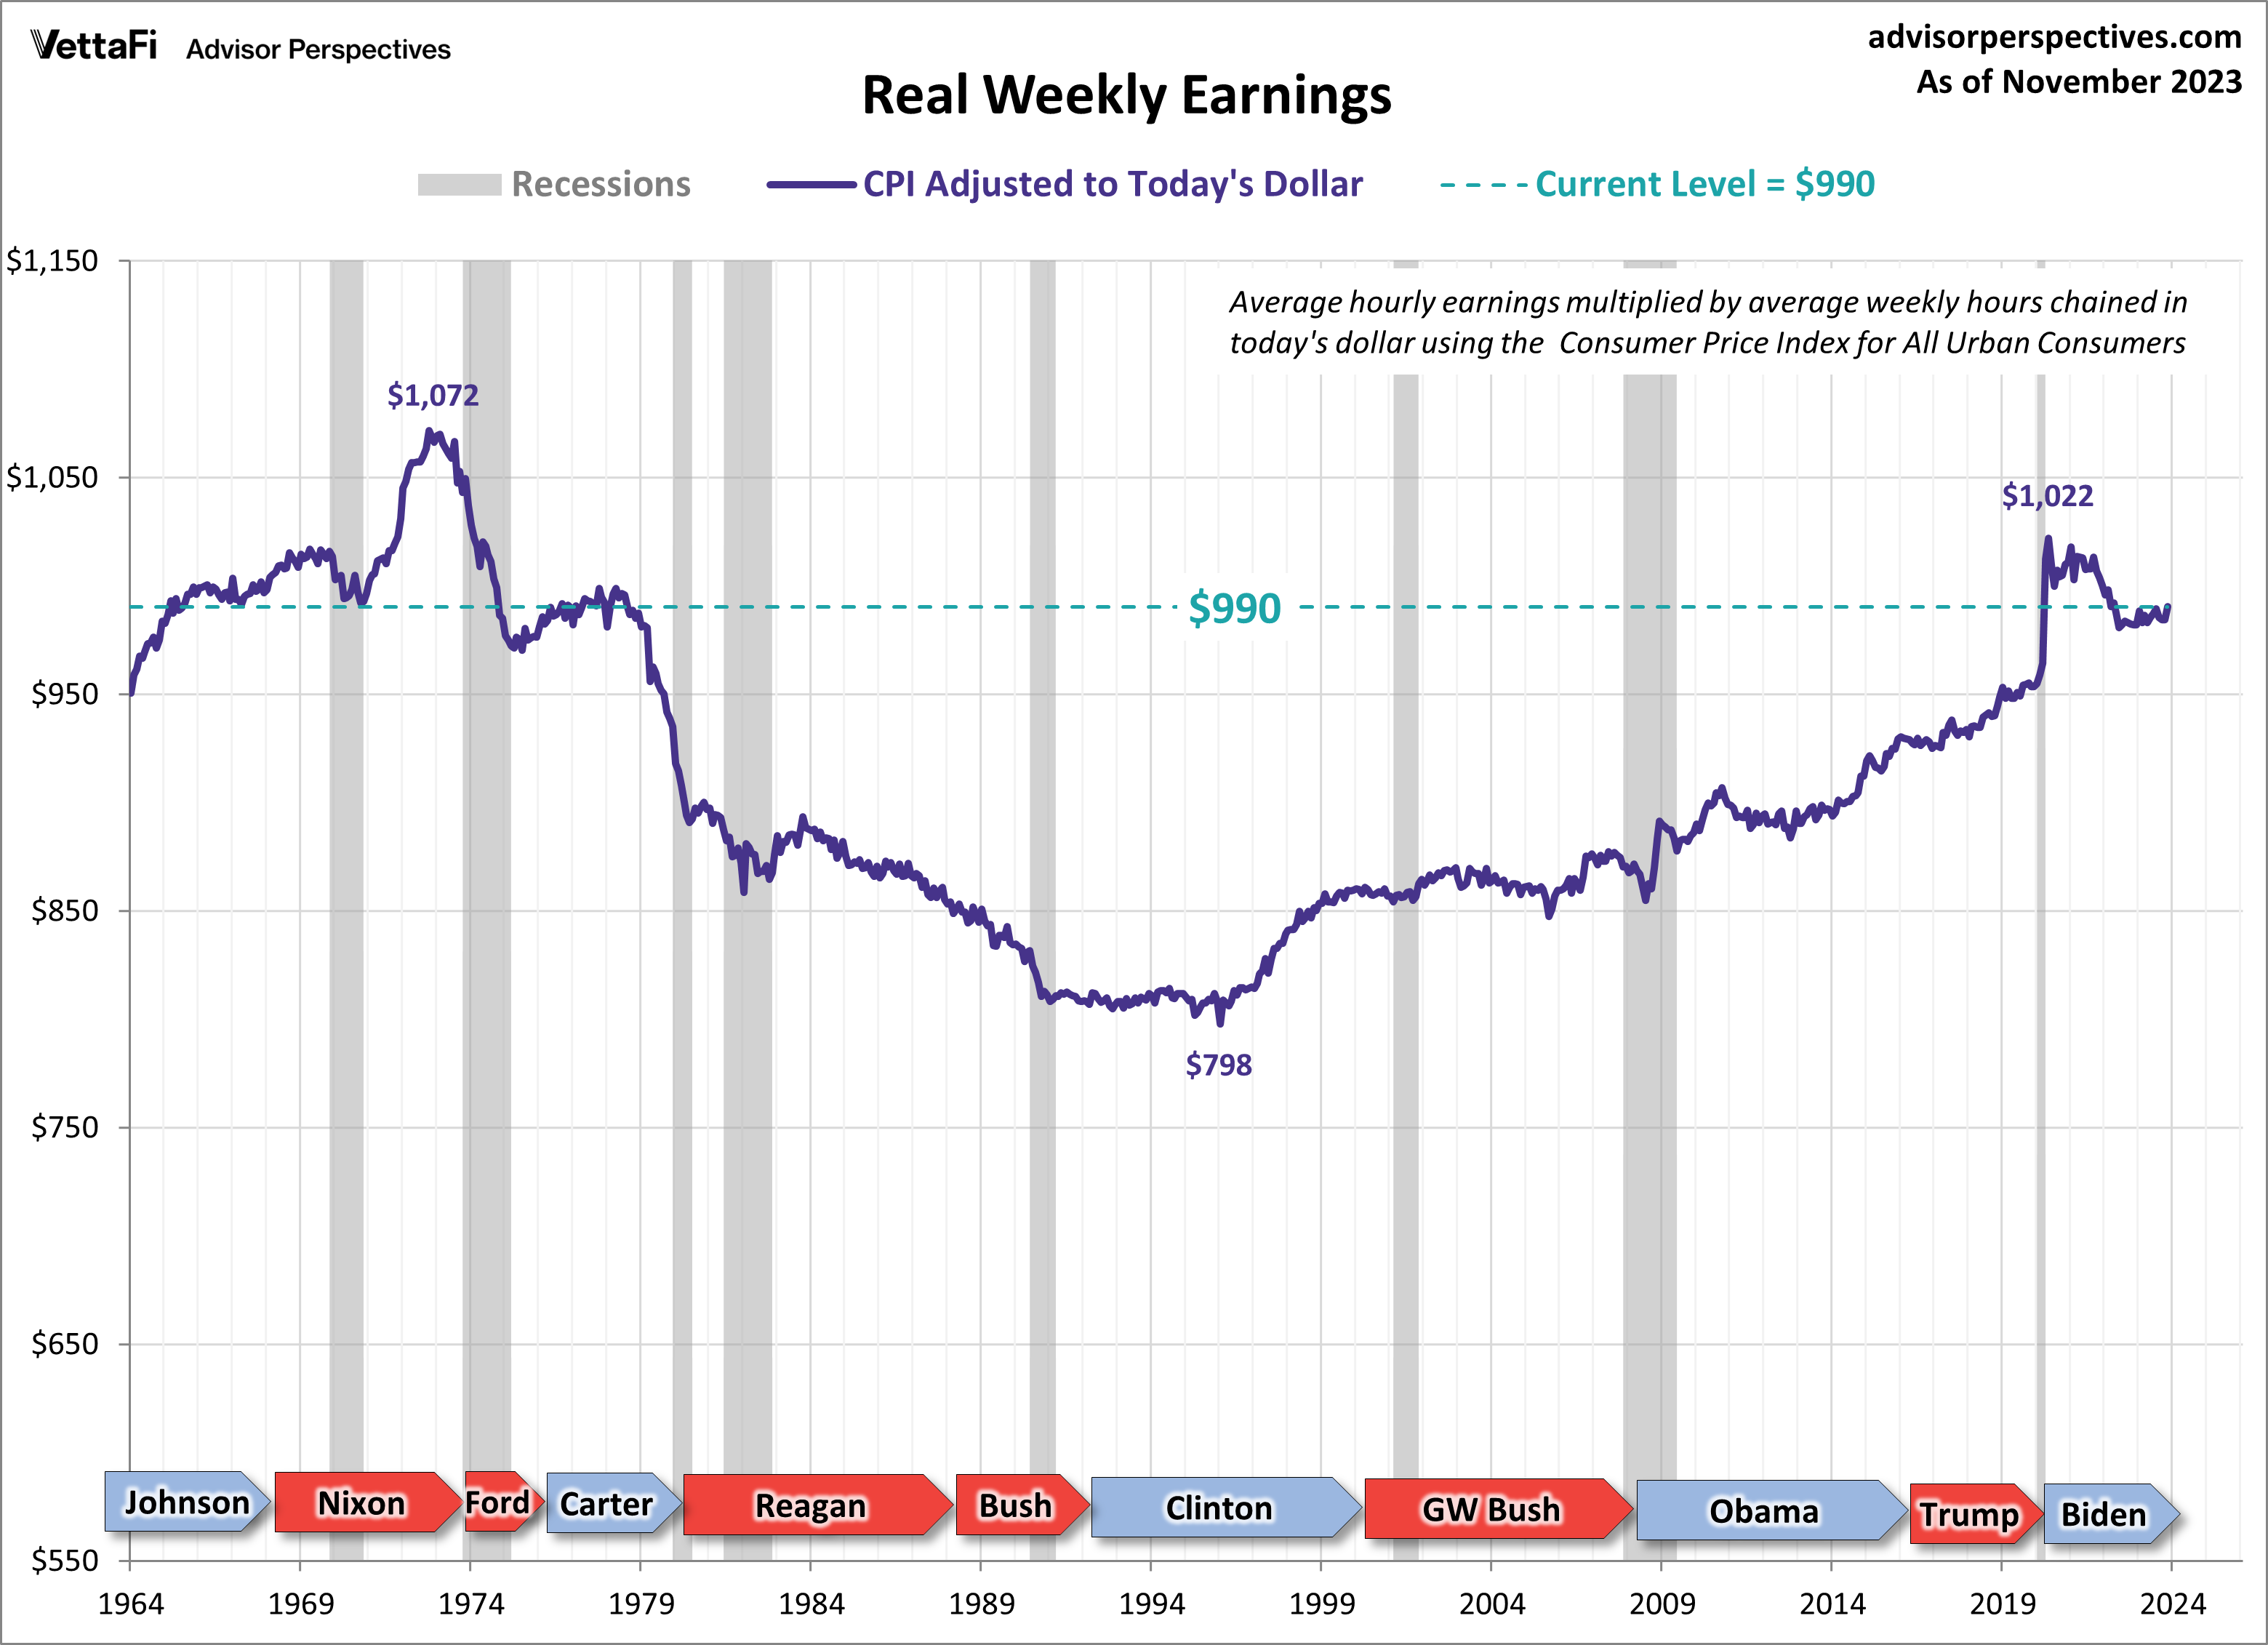
1. Middle Class Hourly Wages
Utilizing the latest CPI and employment data, this chart calculates inflation-adjusted hourly, weekly, and annual earnings. The latest hypothetical real (inflation-adjusted) annual earnings are at $49,517, down 7.67% from over 50 years ago.
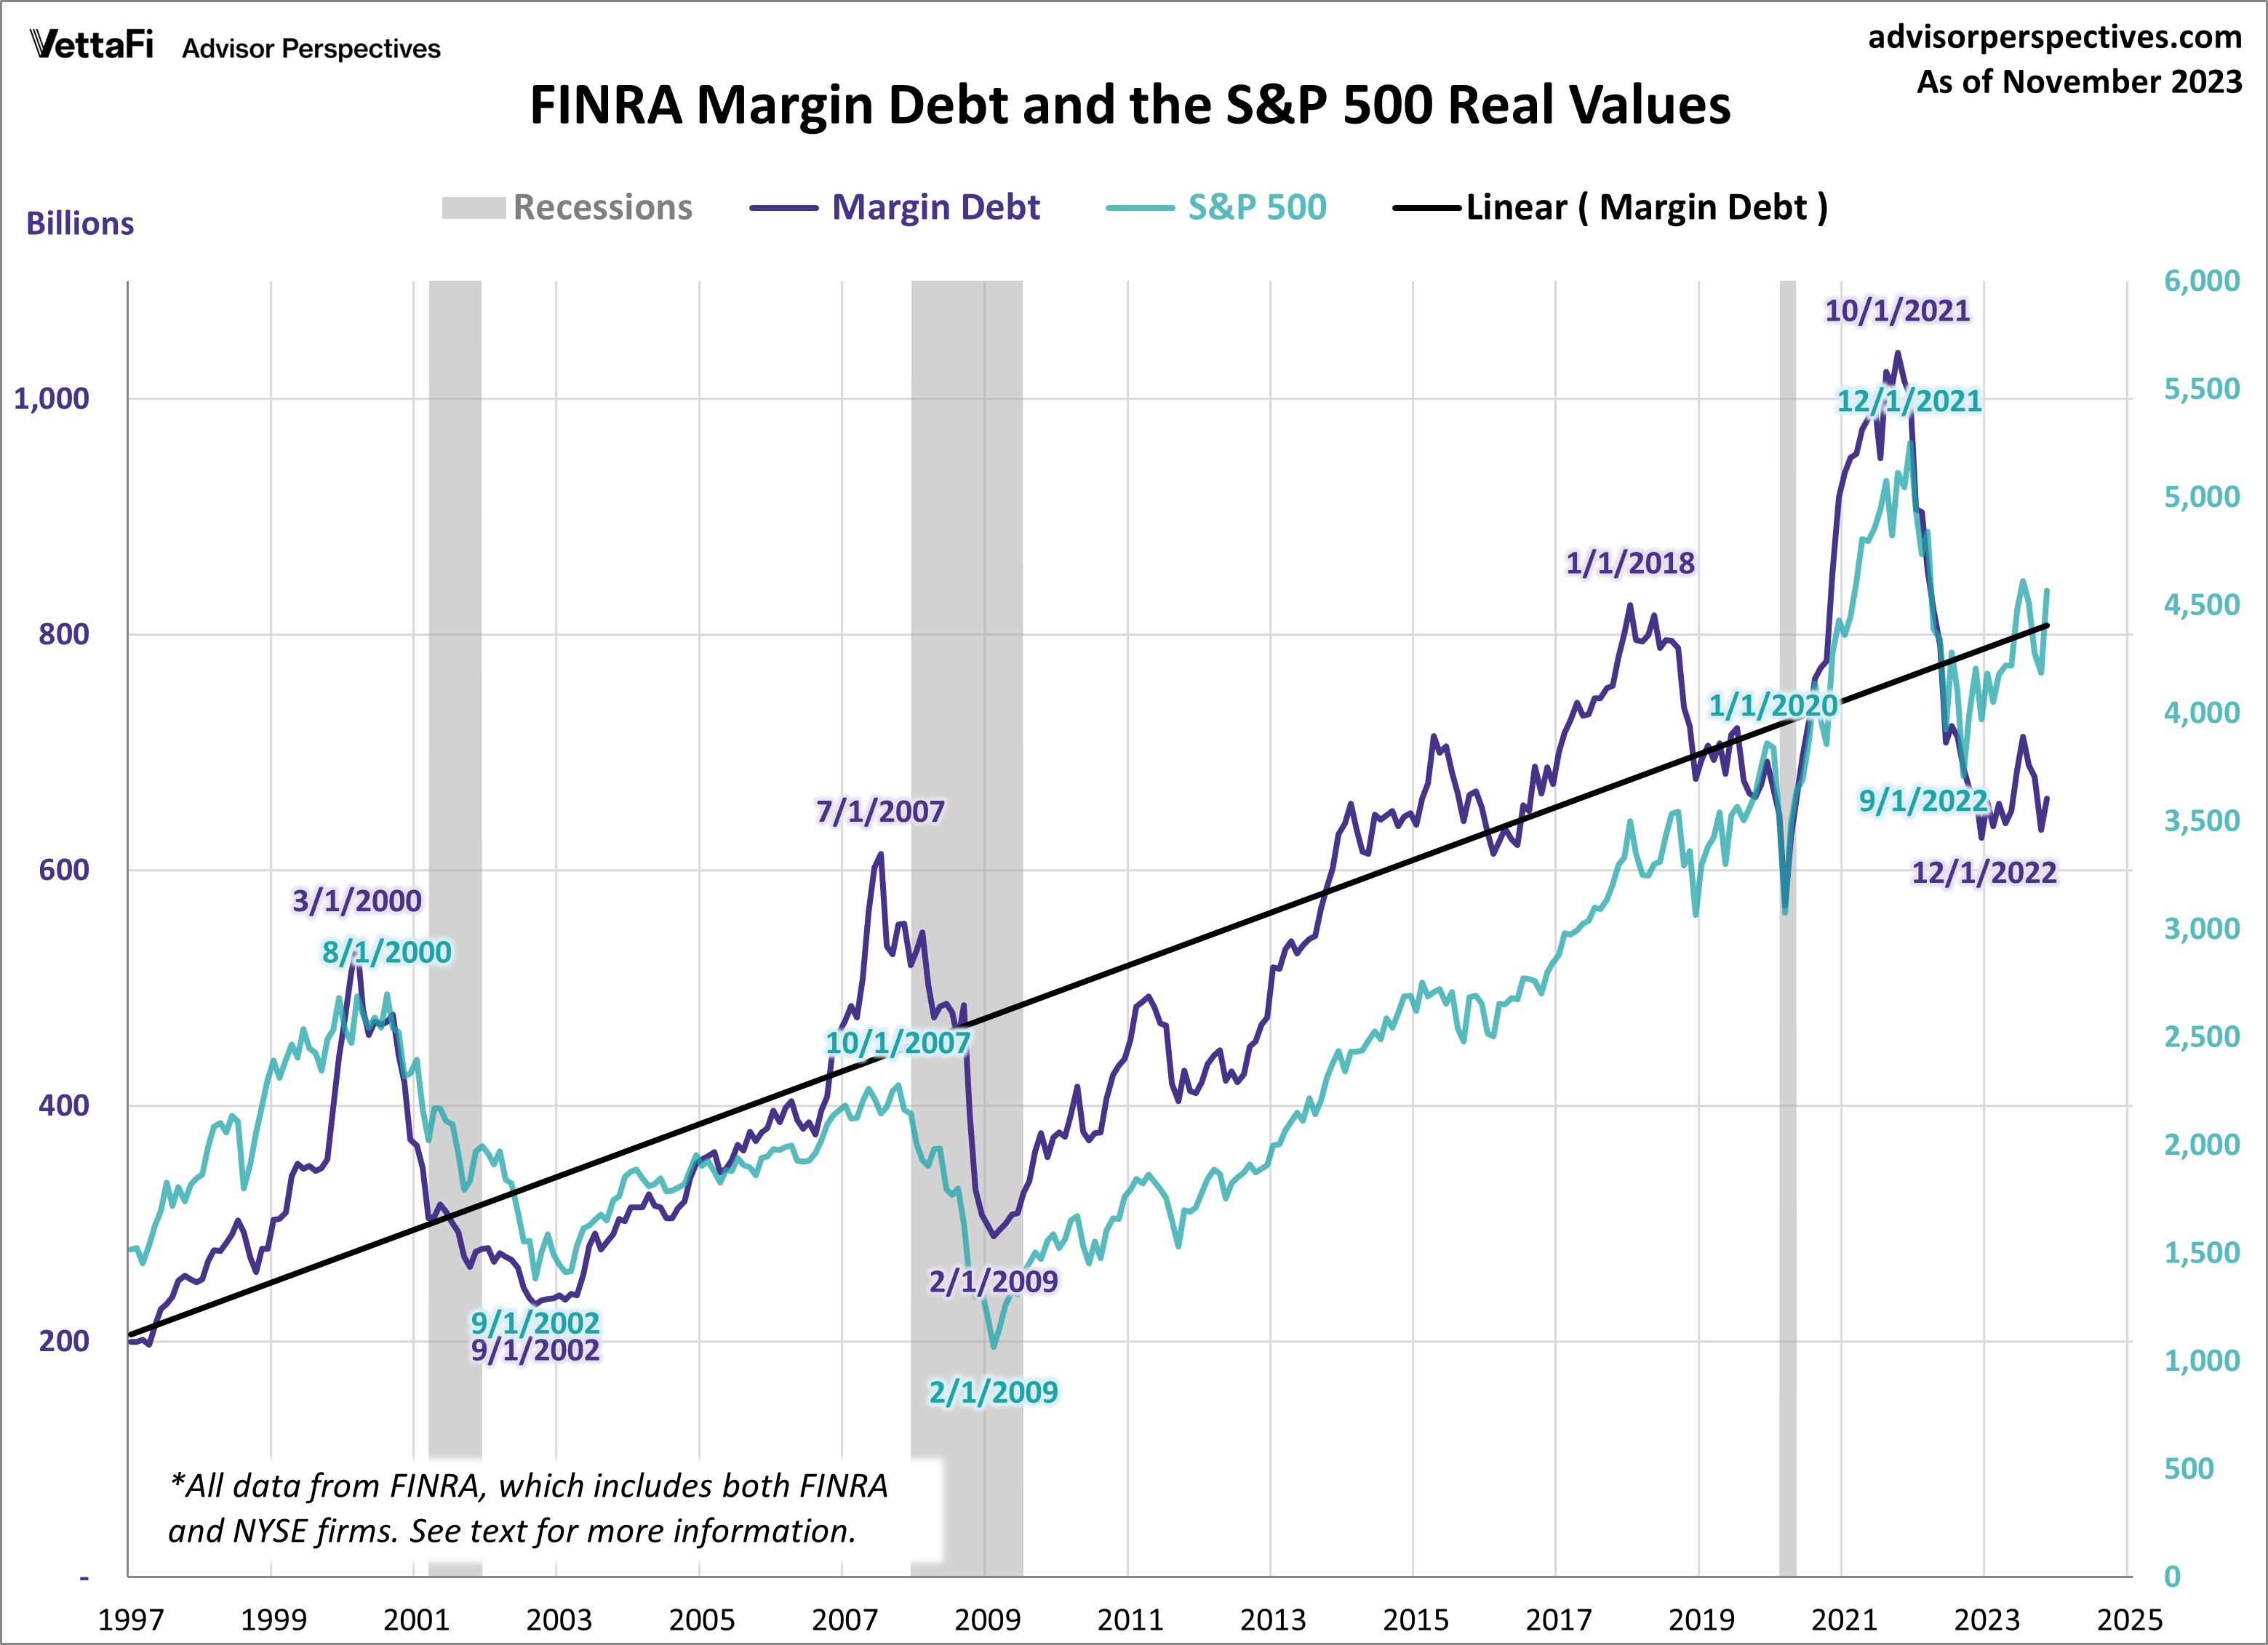
2. Margin Debt
A depiction of the money investors borrowed from brokers via margin accounts. The latest debt level is at $660.89 billion.
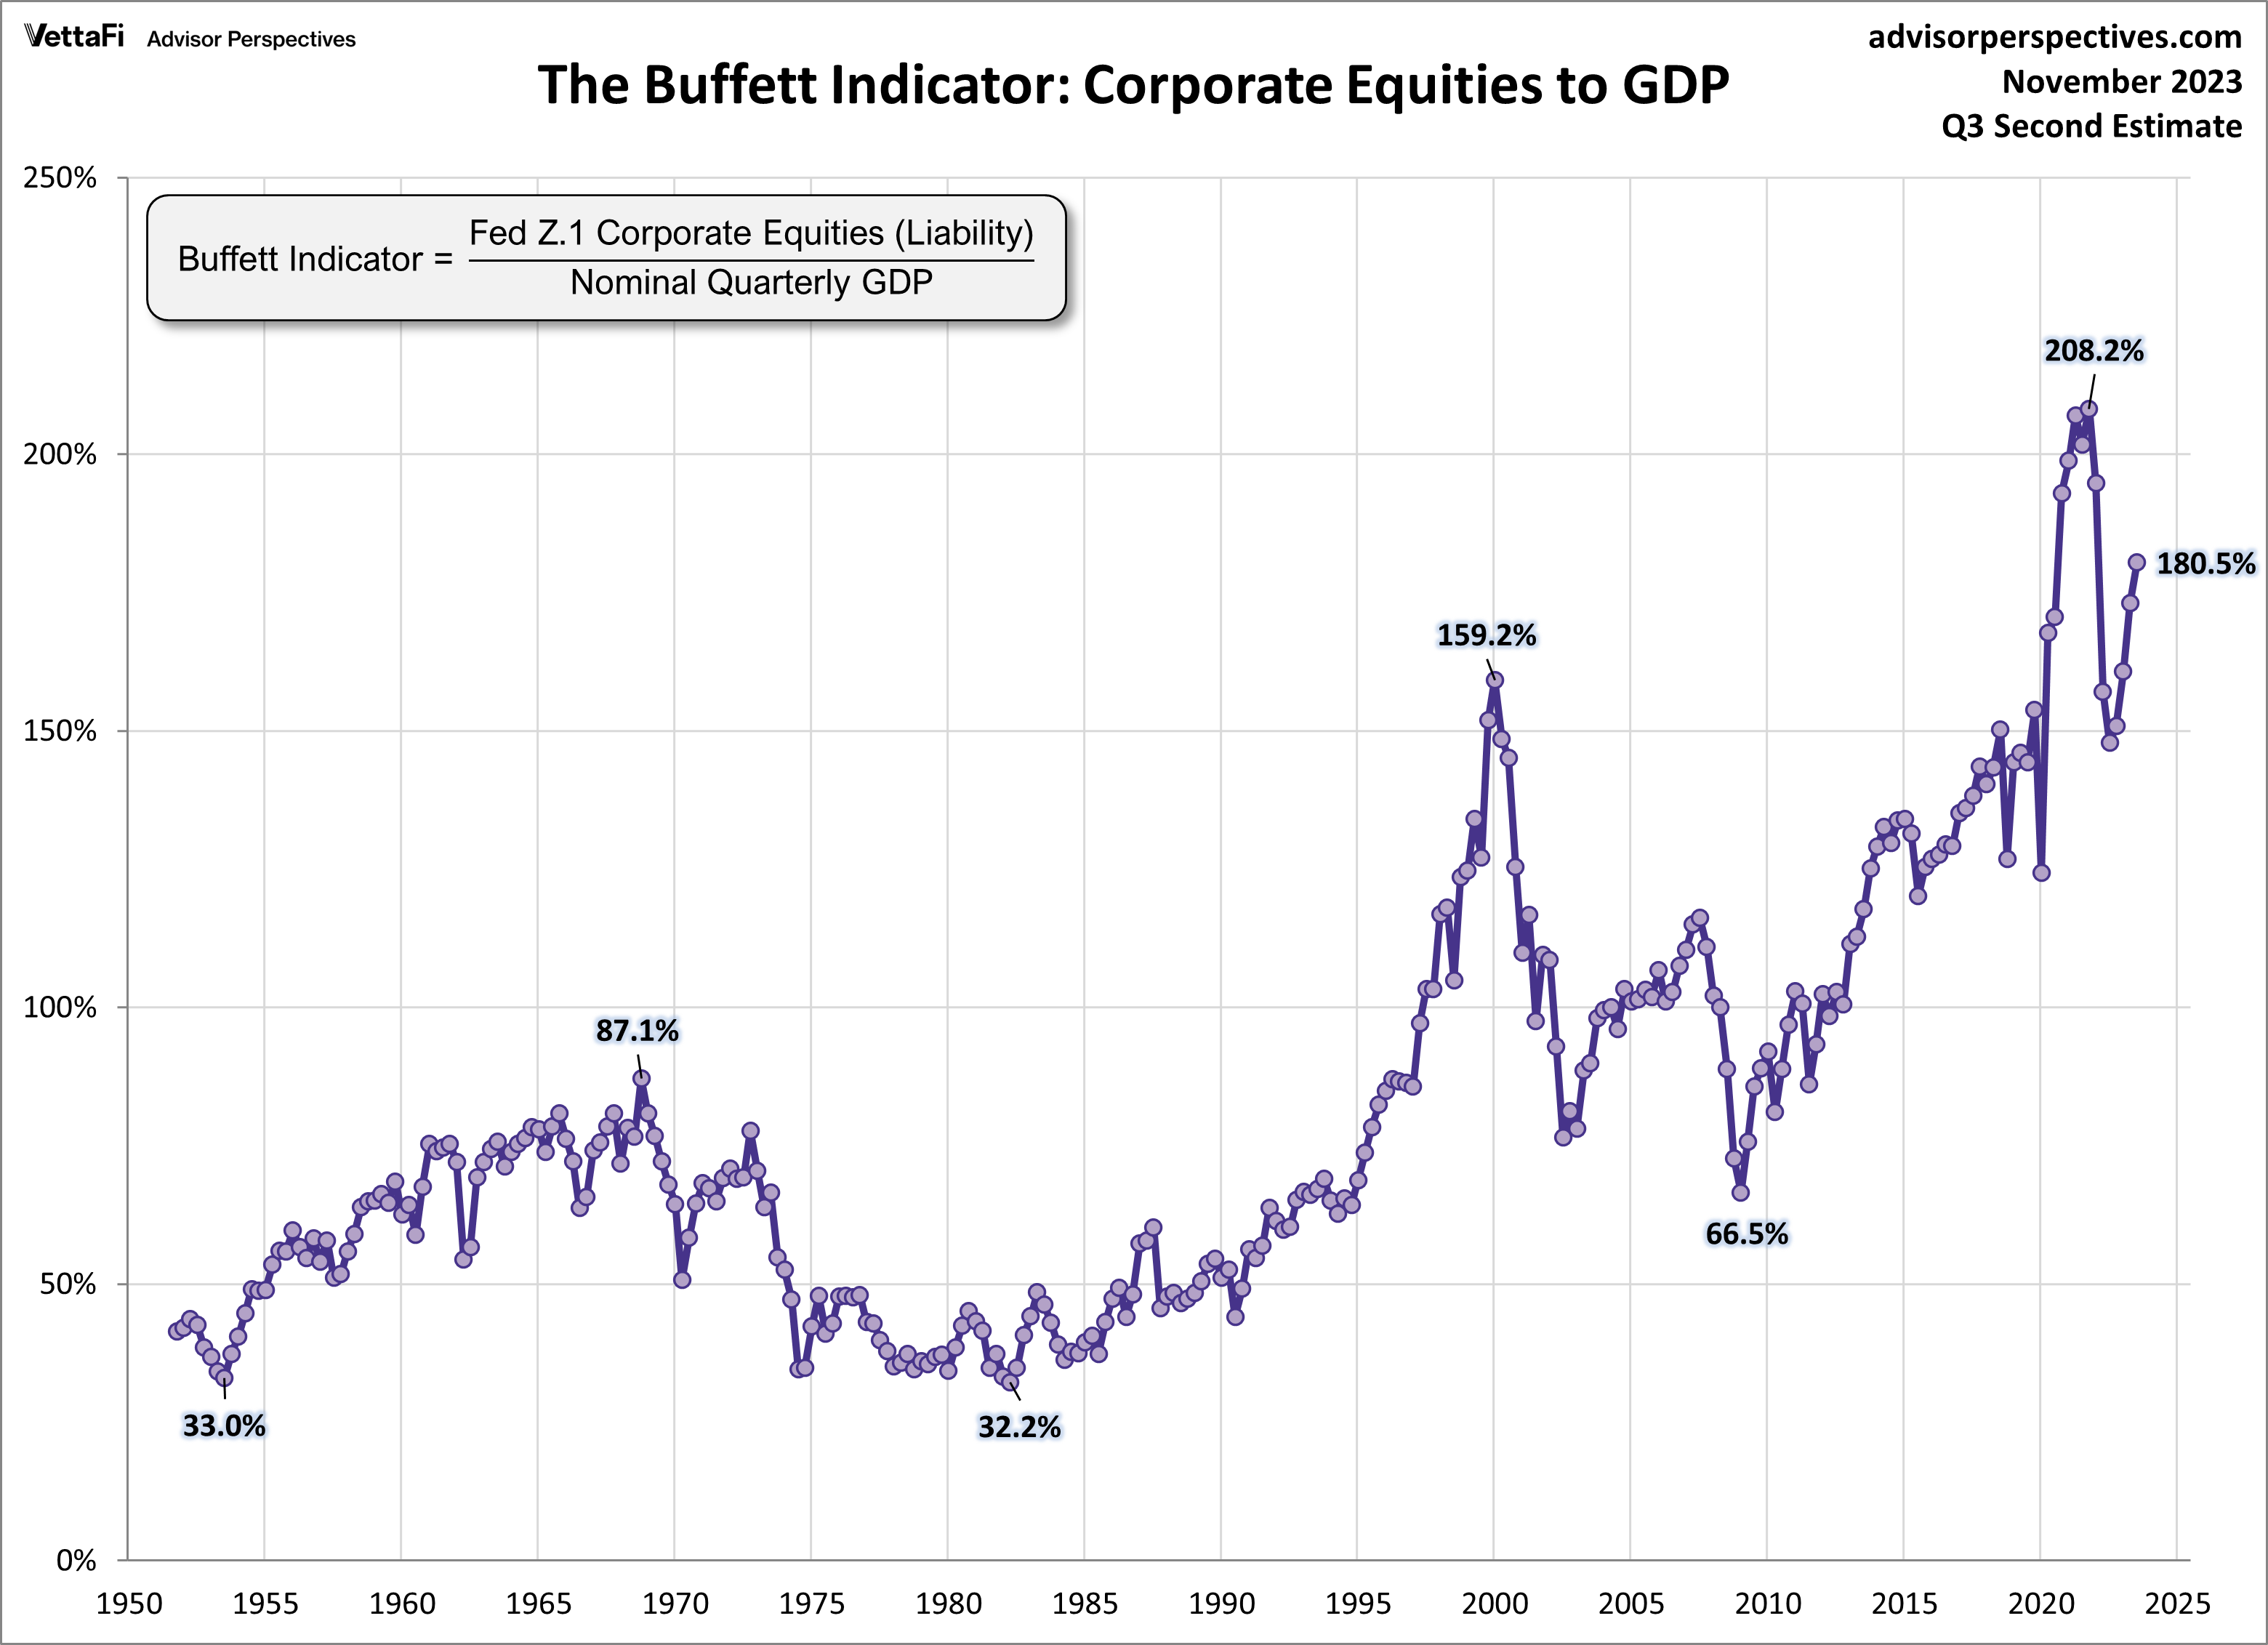
3. Buffett Valuation Indicator
A long-term valuation metric comparing the total market value of publicly traded stocks to the country’s GDP. Using the Q3 GDP 2nd estimate and November S&P 500 close data, latest reading is 180.5%, signaling an overvalued market.
4. Market Valuation Overview
A comparative analysis of four valuation indicators (Regression to Trend, Crestmont P/E, Q-Ratio, and P/E 10). Based on the latest S&P 500 monthly data from November, the market is overvalued somewhere in the range of 71% to 129%, depending on the indicator.

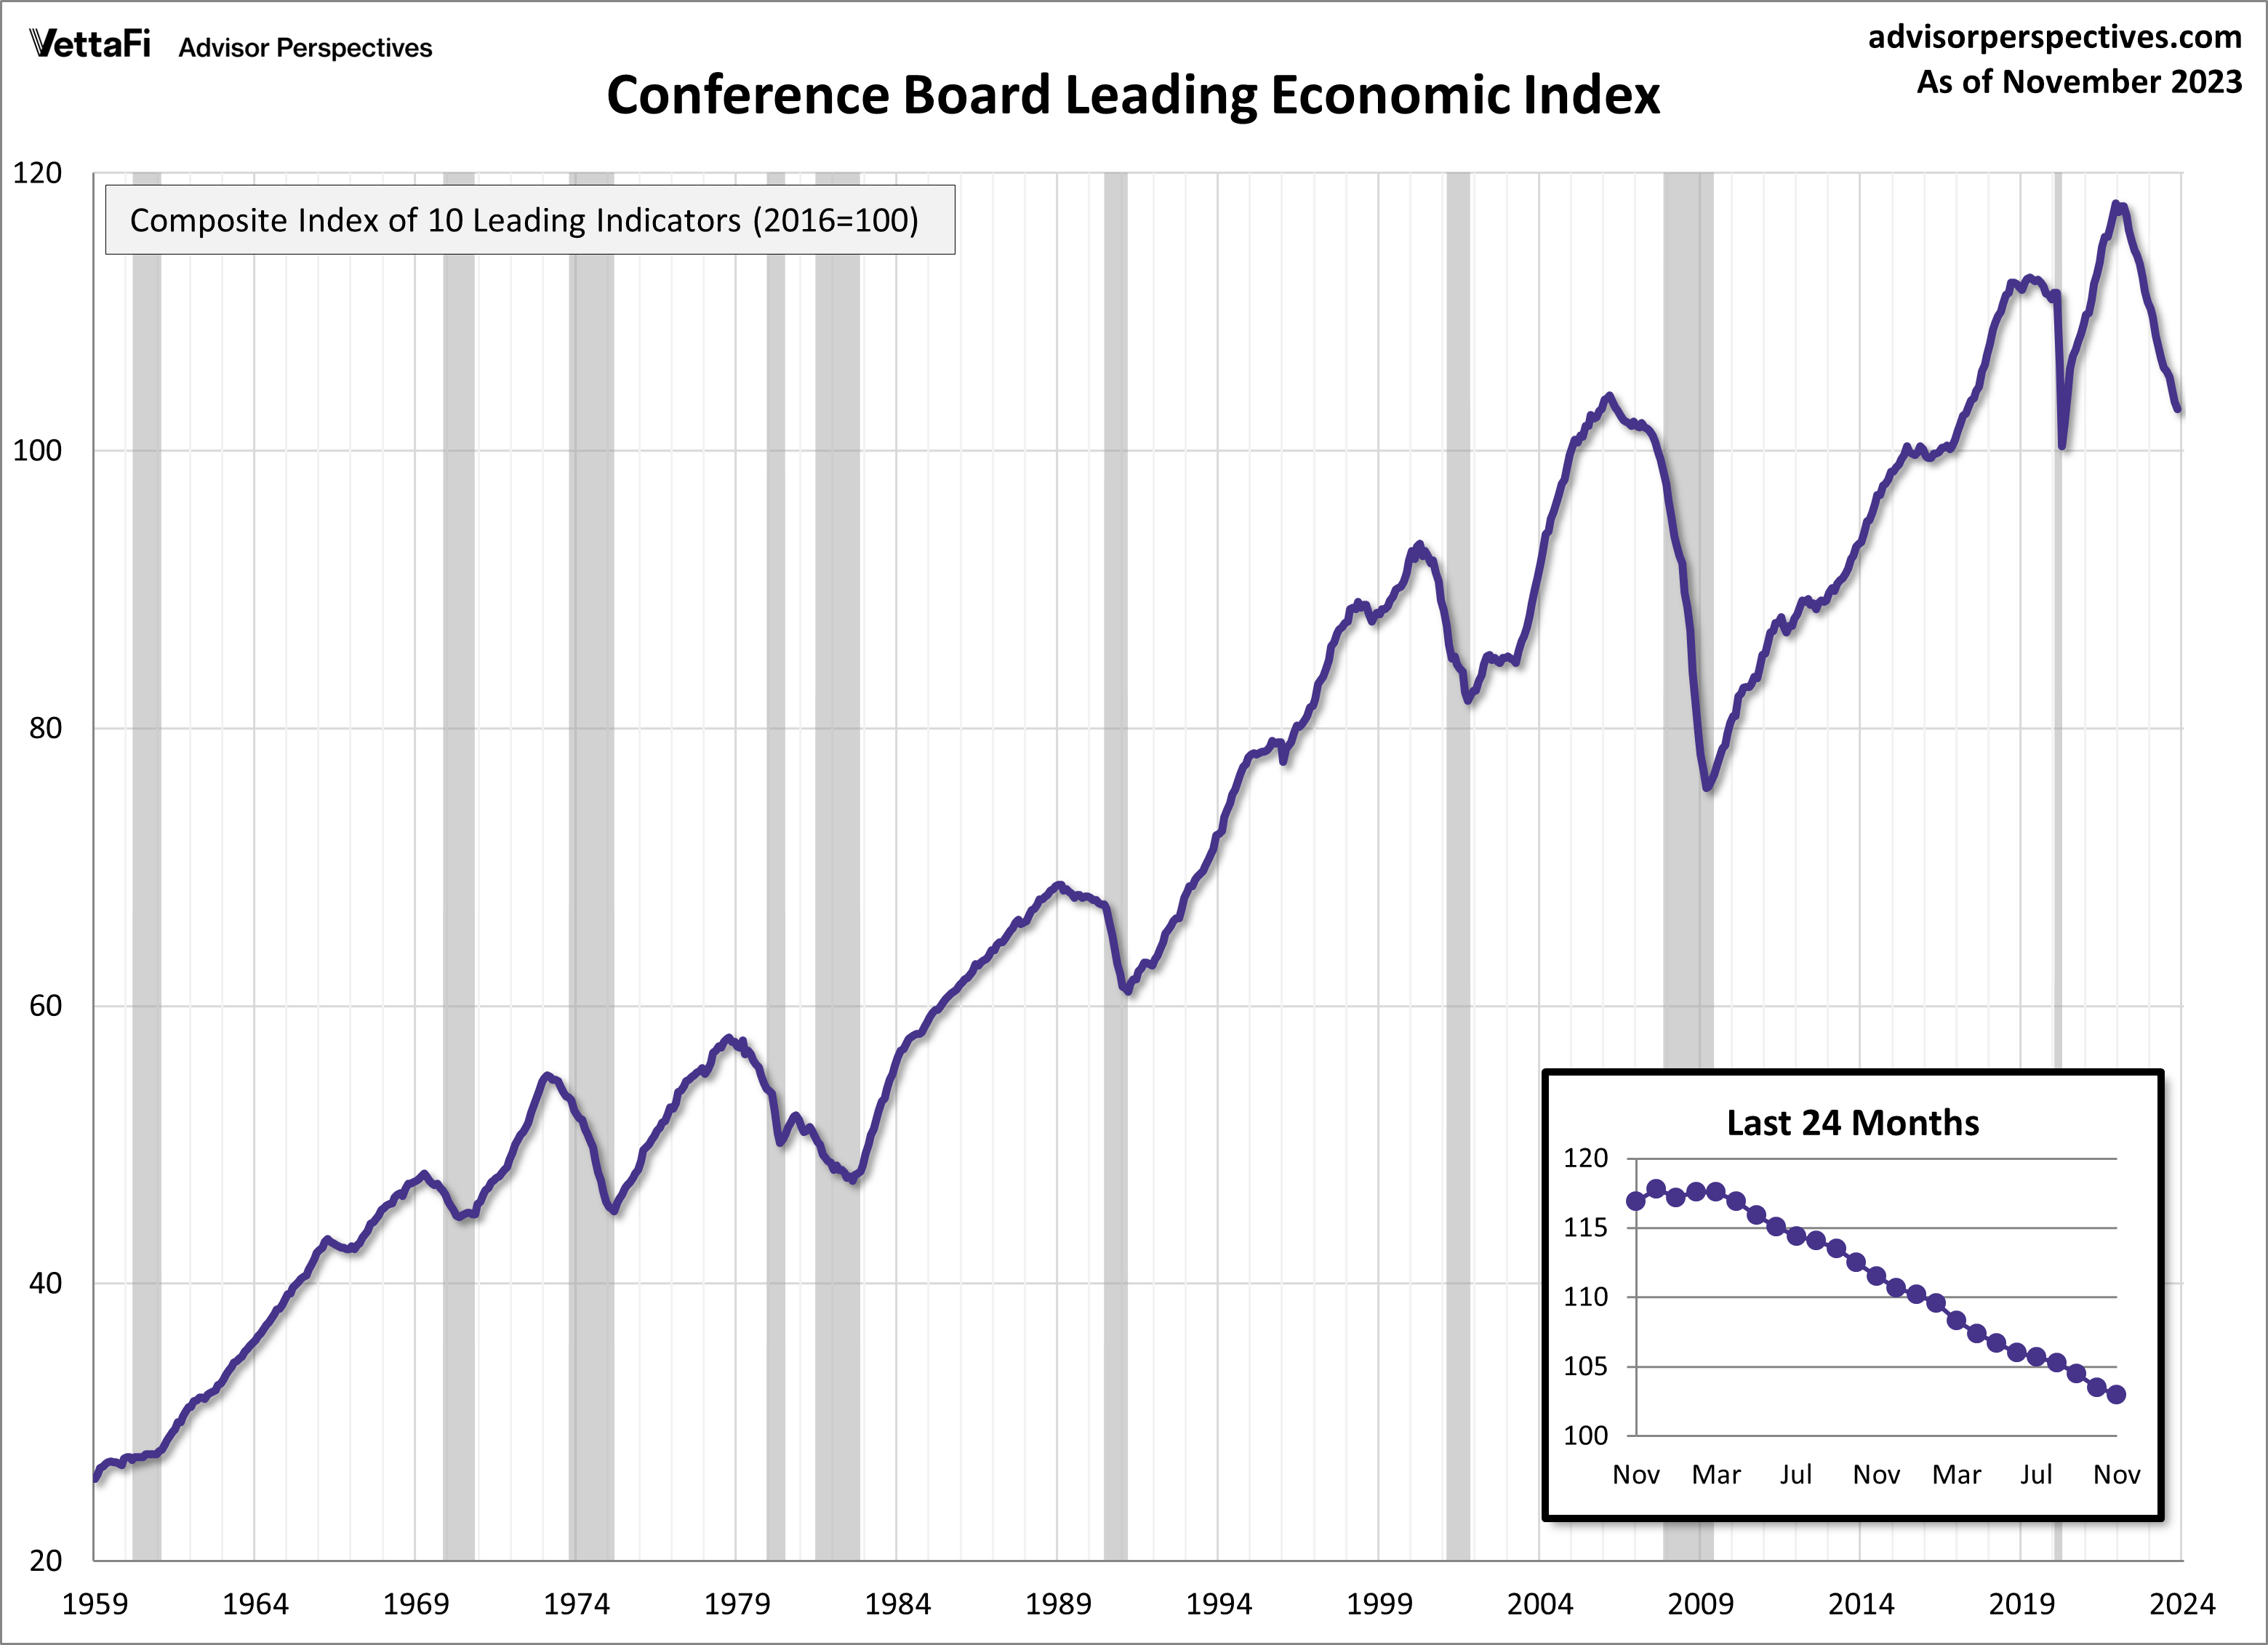
5. Conference Board Leading Economic Index (LEI)
A composite index predicting business cycle turning points and anticipating economic trends. The latest data showed the LEI falling for a 20th consecutive month to 103.0, its lowest reading since May 2020.
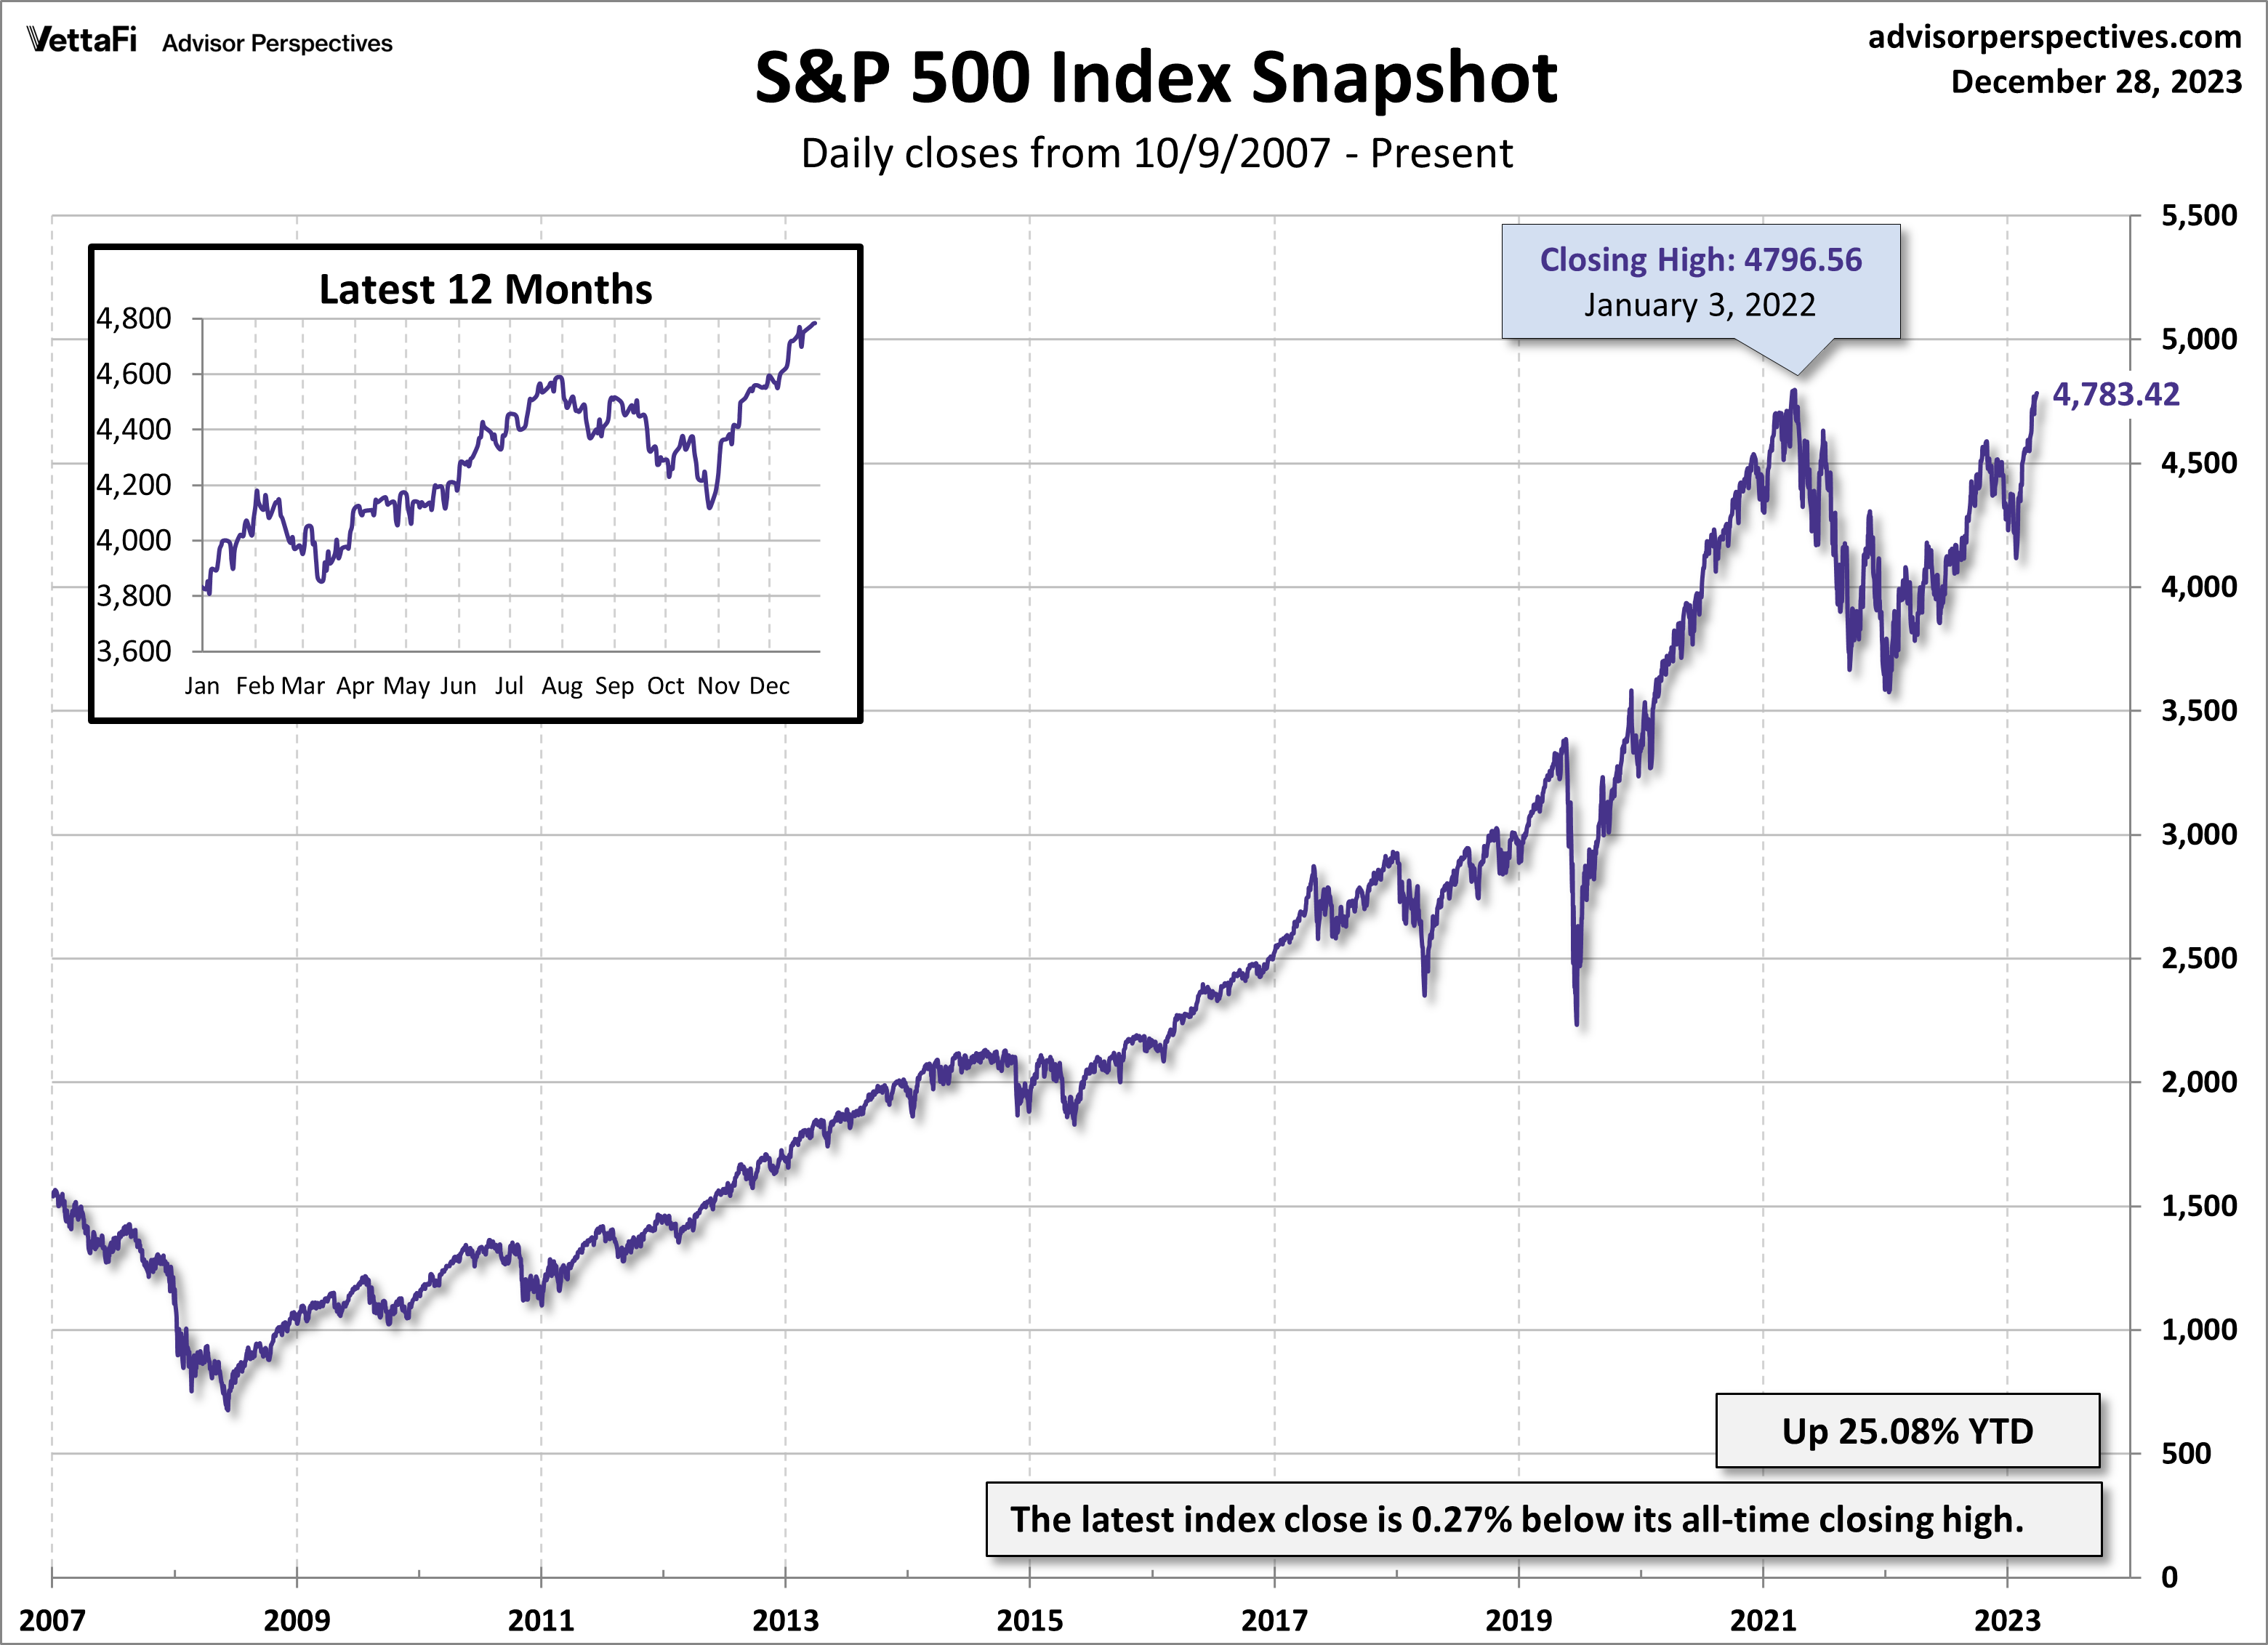
6. S&P 500 Snapshot
A weekly update that highlights the S&P 500’s performance and broader index trends. At the time of writing, the index is up over 25% year to date and sits just below its all-time record high from January 2022.
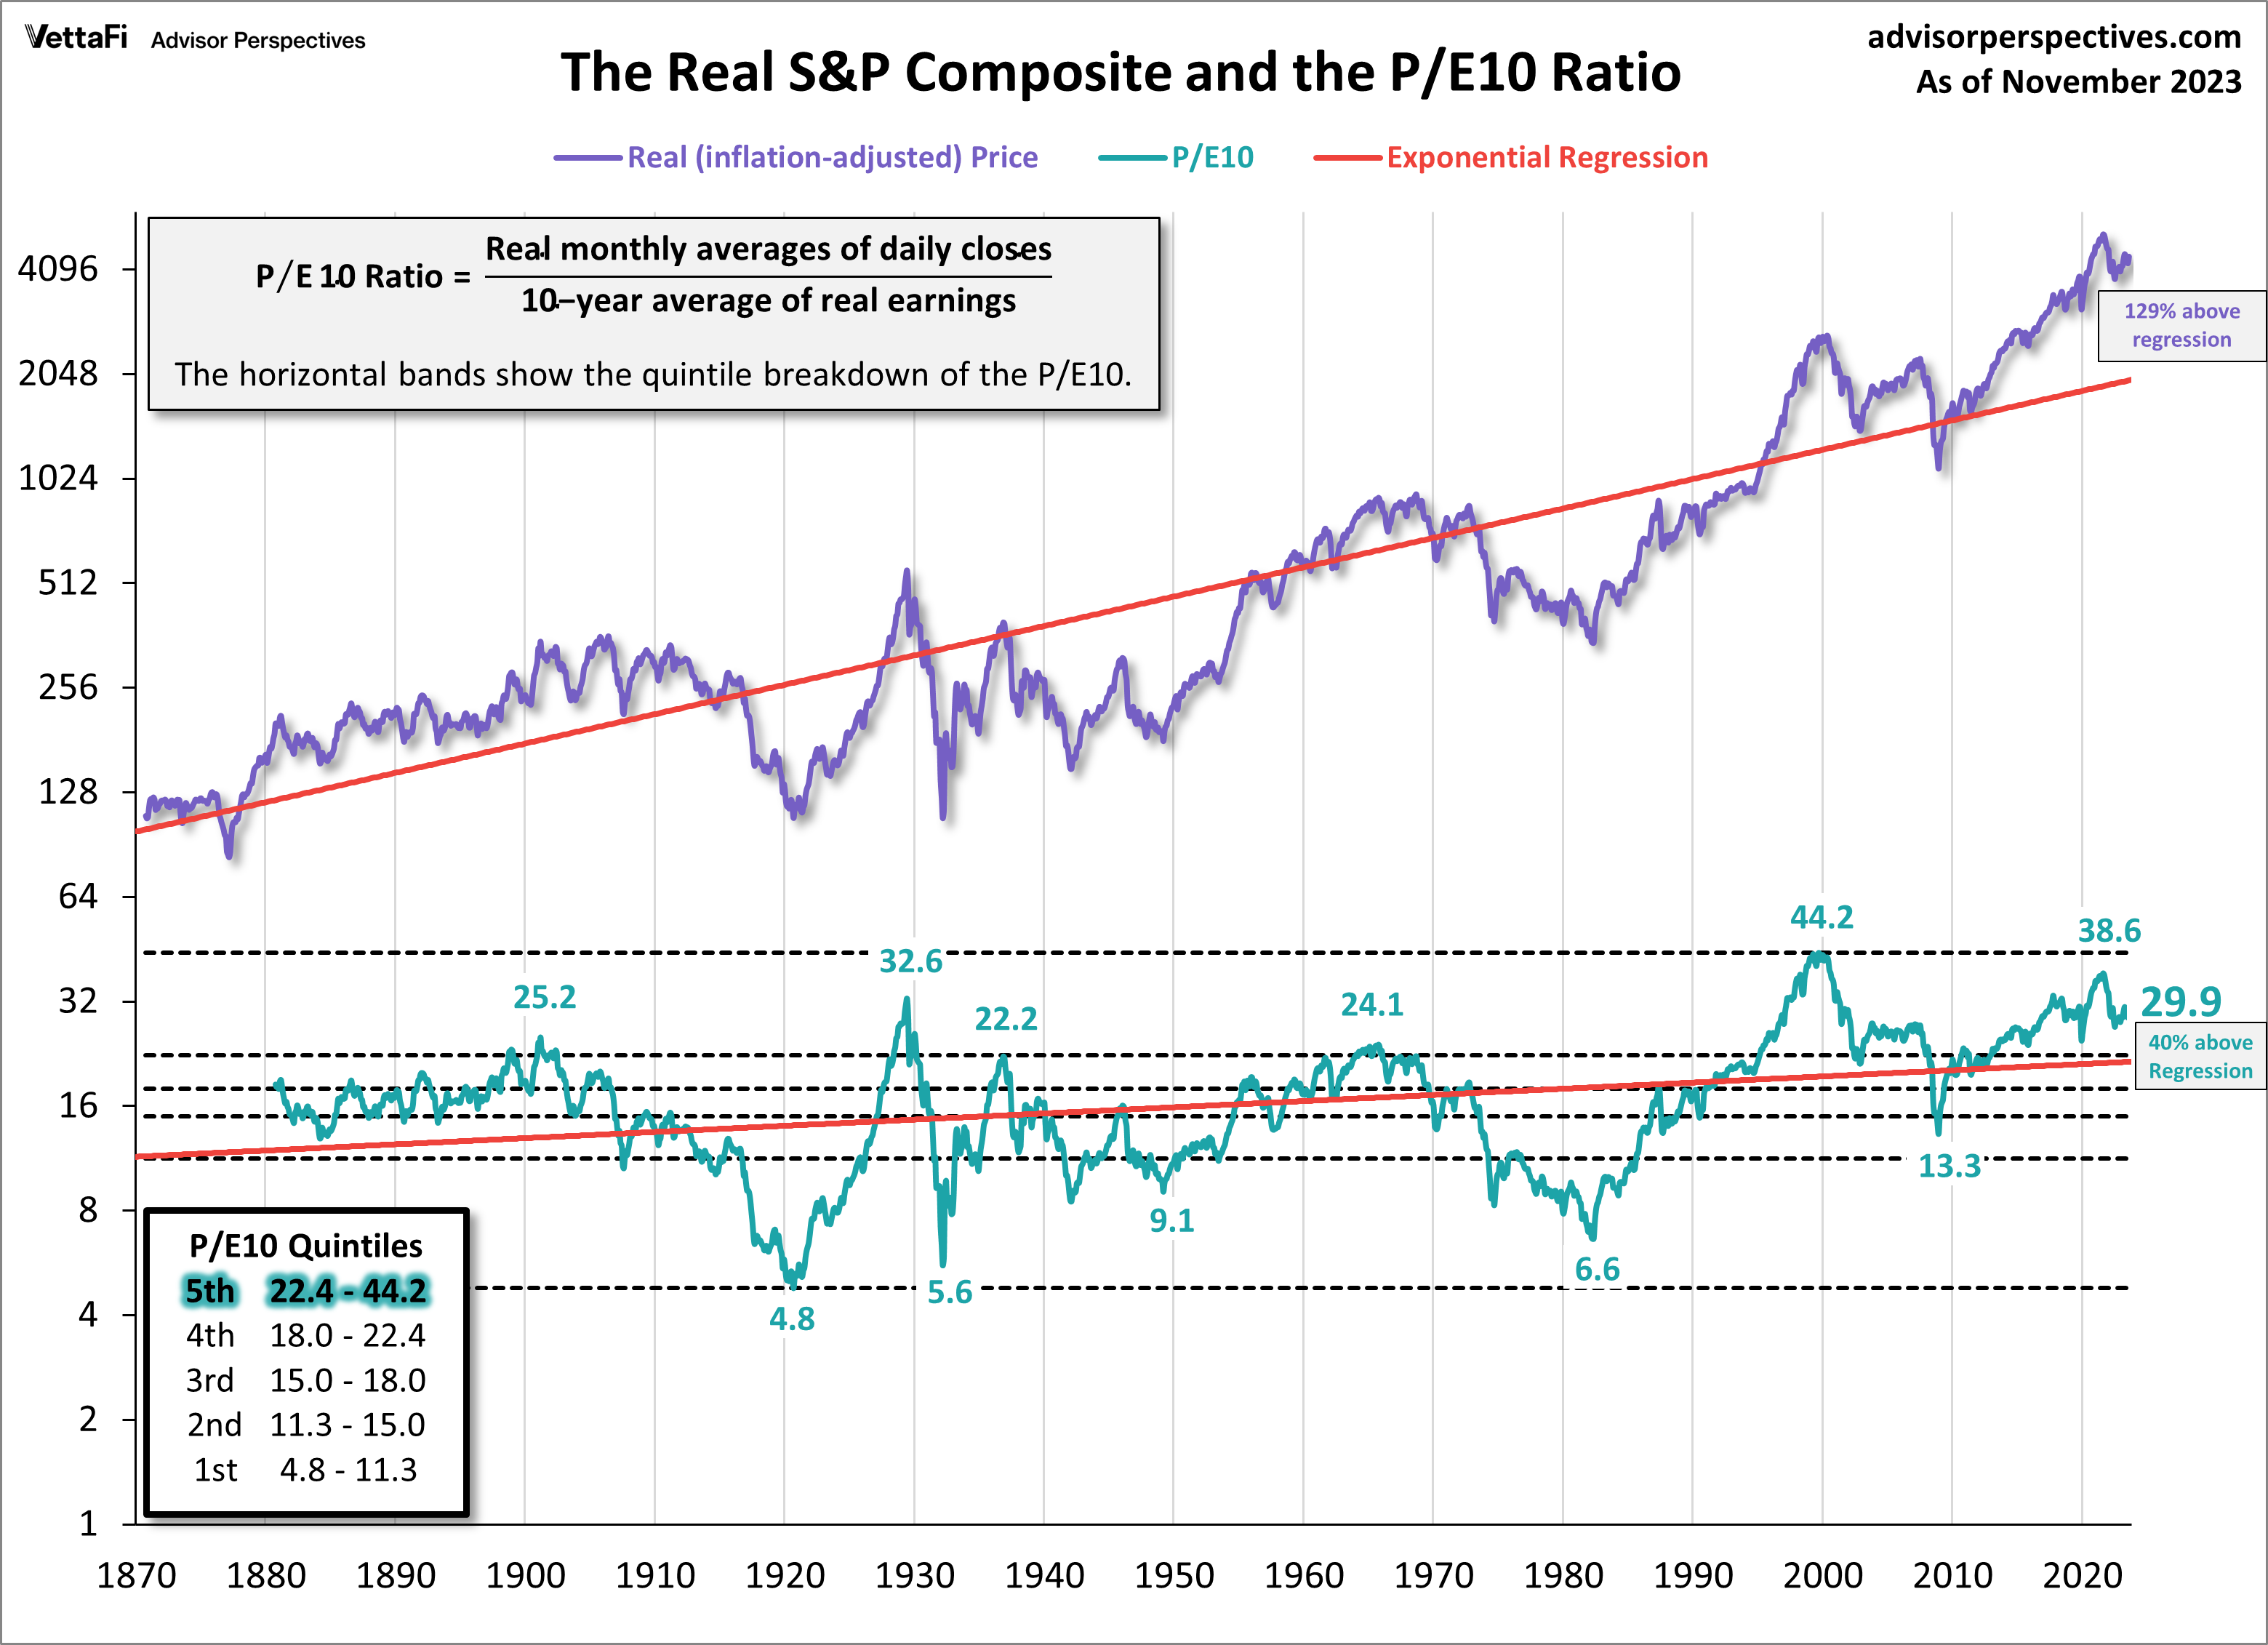
7. P/E 10 Market Valuation Update
A long-term valuation indicator calculated by dividing the current S&P 500 price by the average inflation-adjusted earnings over the past 10 years. As of November, the P/E 10 ratio is at 29.9, signaling an overvalued market.
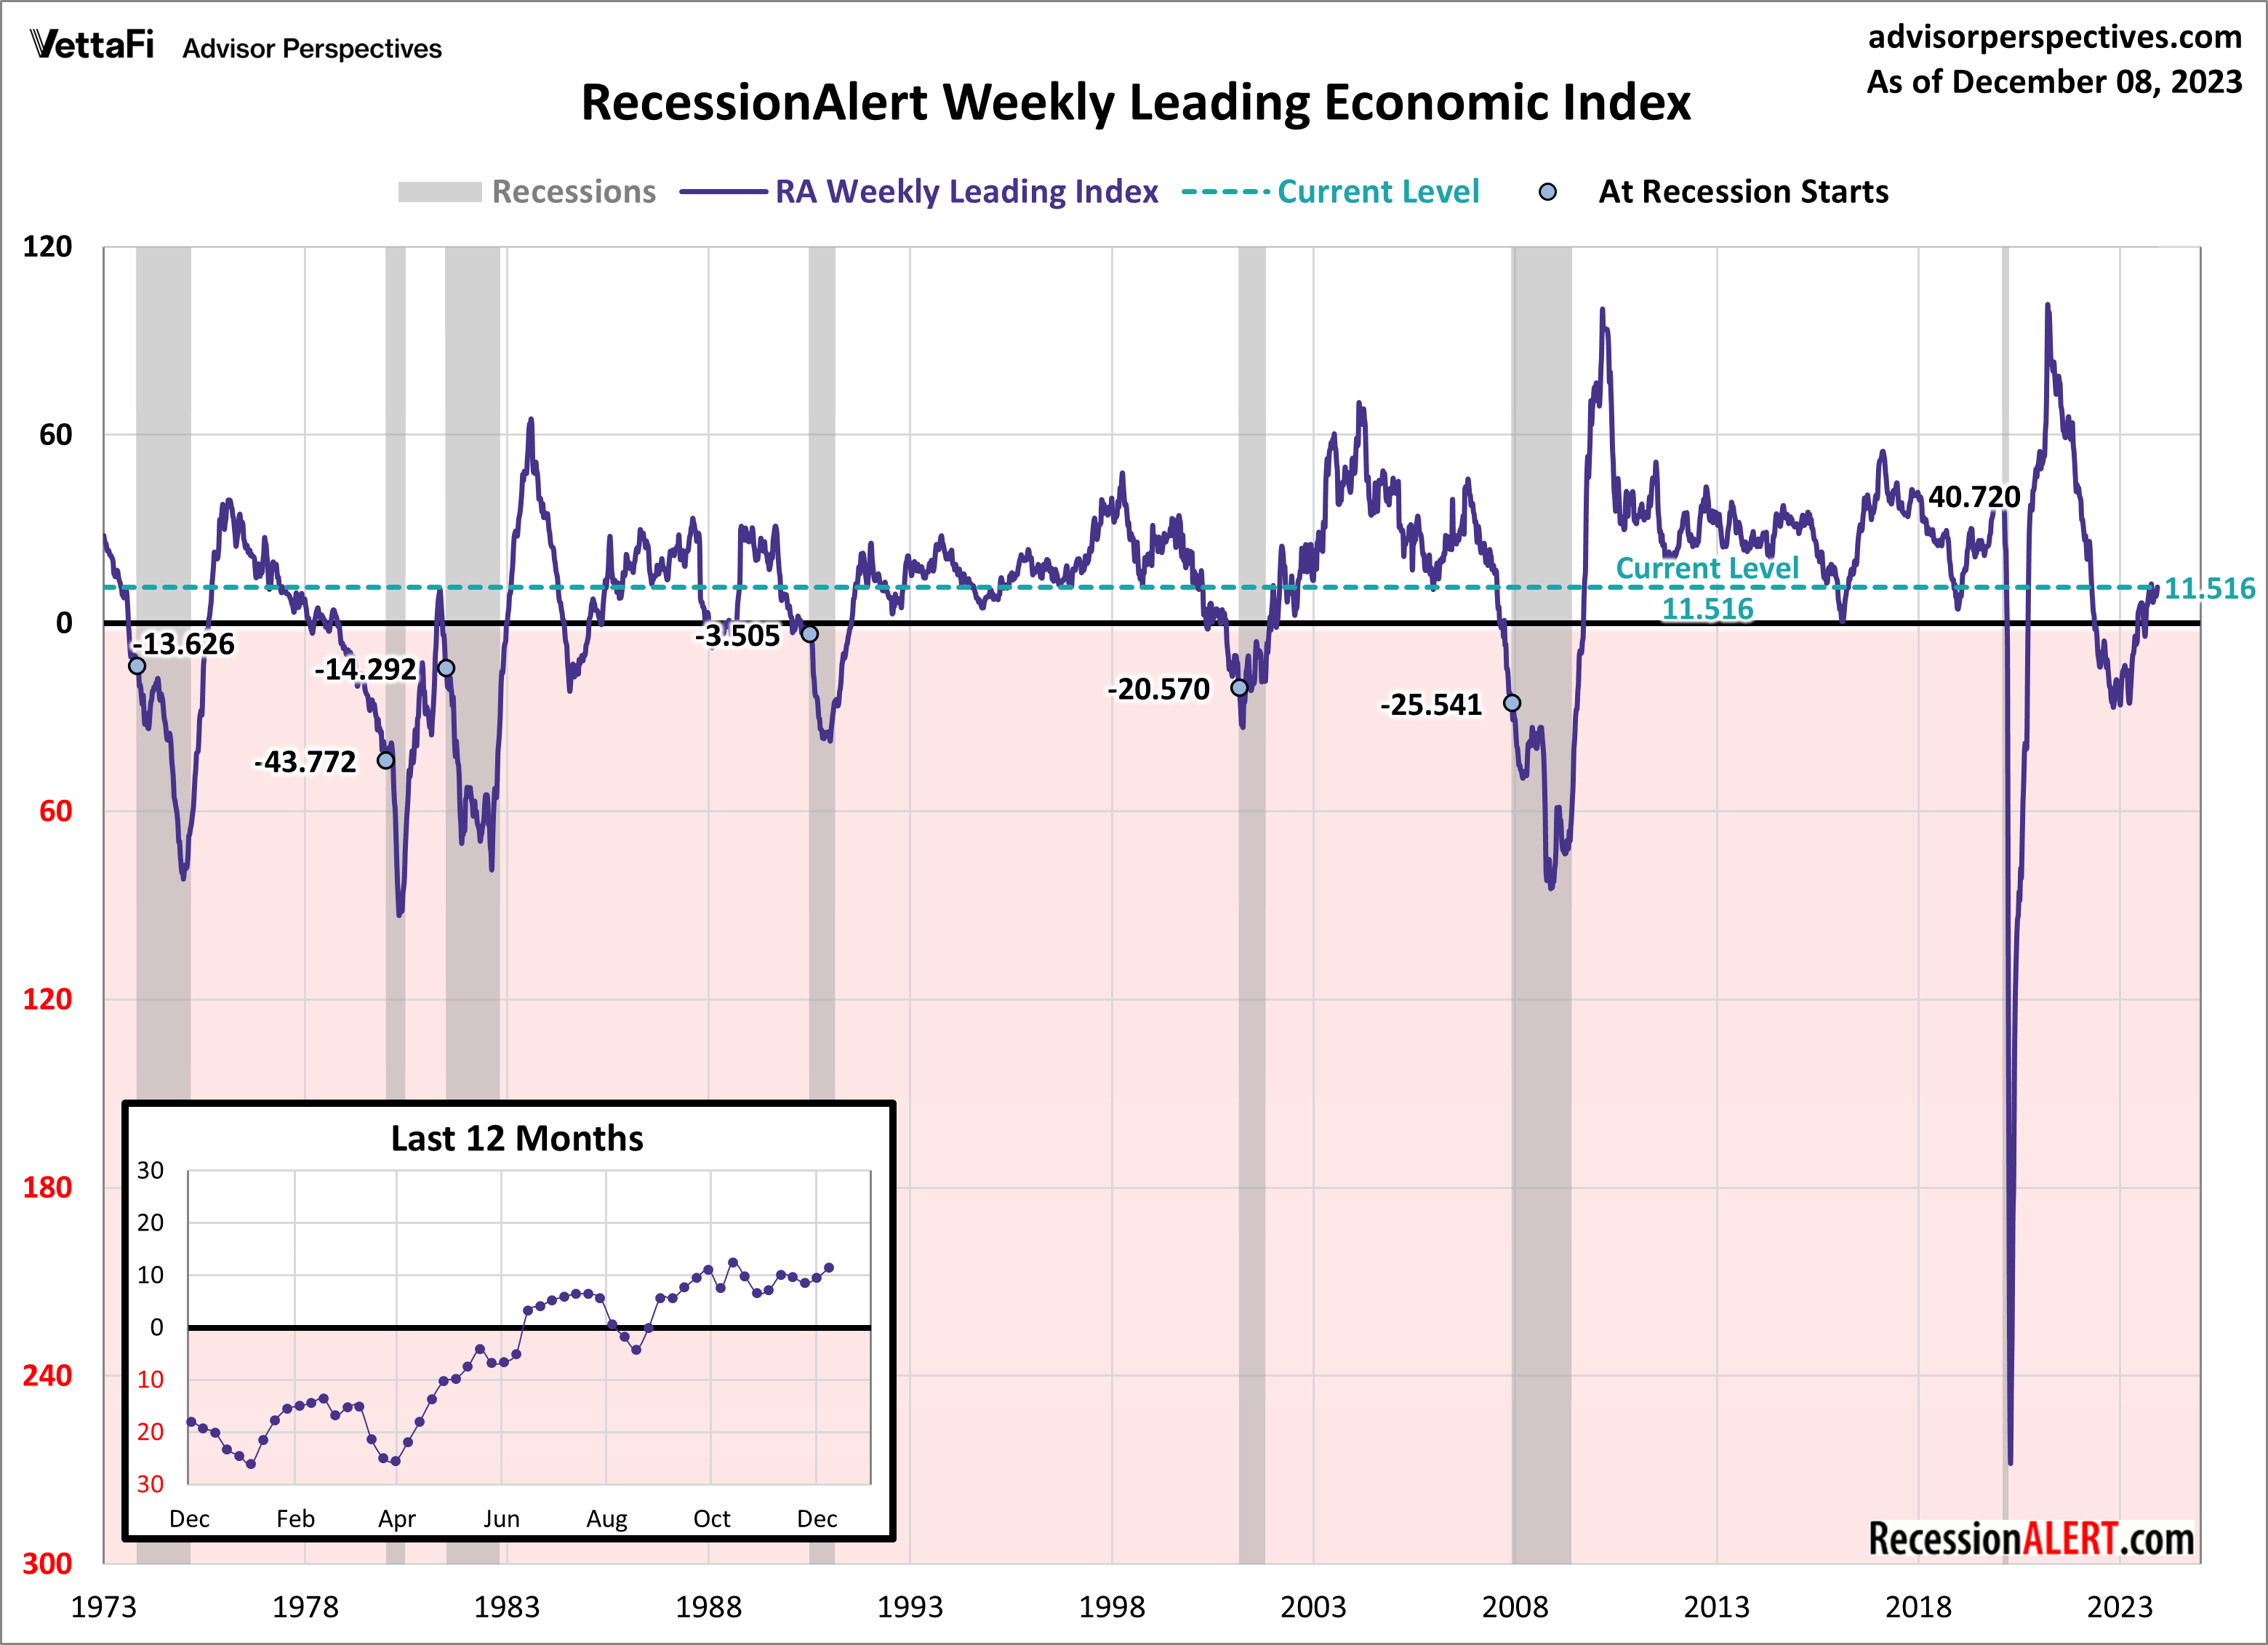
8. RecessionAlert Weekly Leading Index
A composite index anticipating the likelihood of recession based on six broad categories. As of December 8th, the index recorded its 16th consecutive positive reading, with 5 of the 6 components in expansion territory.
9. U.S. Household Incomes: A 50+ Year Perspective
A quintile breakdown of household income trends over the last 50 years with nominal and inflation adjustments. In 2022 the median average household income fell by 2.3% to $74,580.

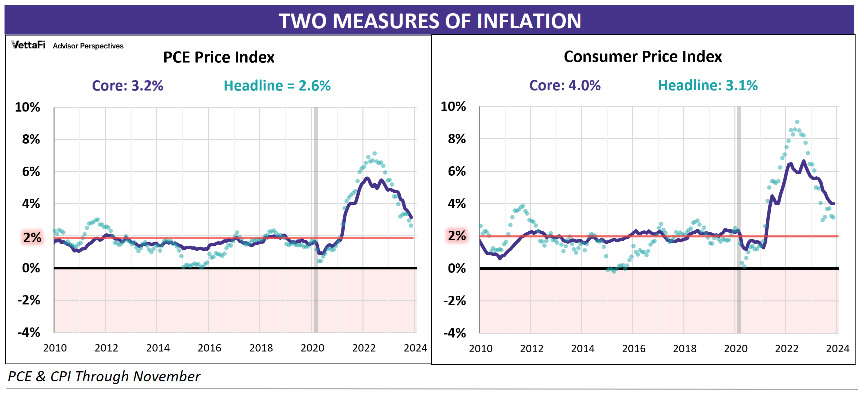
10. Two Measures of Inflation
A comparison between the two main measures of inflation: PCE and CPI. As of November, core PCE was at 3.2% while core CPI was higher, at 4.0%.
ETFs associated with the S&P 500 include: iShares Core S&P 500 ETF (IVV), SPDR S&P 500 ETF Trust (SPY), Vanguard S&P 500 ETF (VOO), and SPDR Portfolio S&P 500 ETF (SPLG).
Originally published on Advisor Perspectives.
For more news, information, and analysis, visit VettaFi | ETF Trends.
