
By Michael Jones, RiverFront Investment Group
Our 2018 Outlook predicted a tough year for bond investors, as the Federal Reserve (the Fed) continues its steady increase in short-term interest rates and winds down its bond portfolio after years of Quantitative Easing (QE) bond purchases.
Both of these actions are likely to put upward pressure on interest rates and downward pressure on bond prices, in our view. We believe the recently announced Congressional budget agreement, combined with the Trump administration’s new longer term budget blueprint, have the potential to make a tough year for bond investors even tougher. The fiscal picture for the US has deteriorated enough that we think we could see an extended period of rising rates in the US, and the end of the 35 year bull market for bonds.
Trillion Dollar Deficits as Far as the Eye Can See
As far as we can determine, Congress resolved bitter conflicts over spending priorities by essentially allowing everyone to spend more on nearly everything. Republicans won an additional $165 billion in defense spending over the next two years, while Democrats received a $131 increase in domestic spending. This nearly $300 billion in new spending would be in addition to any agreement on an infrastructure program, which both sides are hoping to pass in the near future.
Within a few days of the Congressional budget deal, the Trump administration released its longer term budget blueprint. These budget blueprints specify presidential priorities for spending and taxes and set the terms for Congressional debate over actual budget legislation. The astonishing surprise within the new Trump budget proposal is that a combination of tax cuts and new spending initiatives are expected to cause the cumulative budget deficit to “explode over the next 10 years to $7.1 trillion.”1. If accurate, this represents a more than doubling of the already alarming $3.4 trillion increase in total debt that the Trump administration forecast in last year’s budget blueprint.
The Trump administration’s calculations suggest that annual budget deficits can stay just under $1 trillion, but include projected budget cuts that proved politically impossible in the just completed Congressional budget negotiations. For example, Maya MacGuineas, president of the nonpartisan Committee for a Responsible Federal Budget (CRFB), notes that the Trump budget blueprint “assumes an ultimate cut in non-defense discretionary spending by 40 percent when we just hiked it by over 10 percent.”
![]()
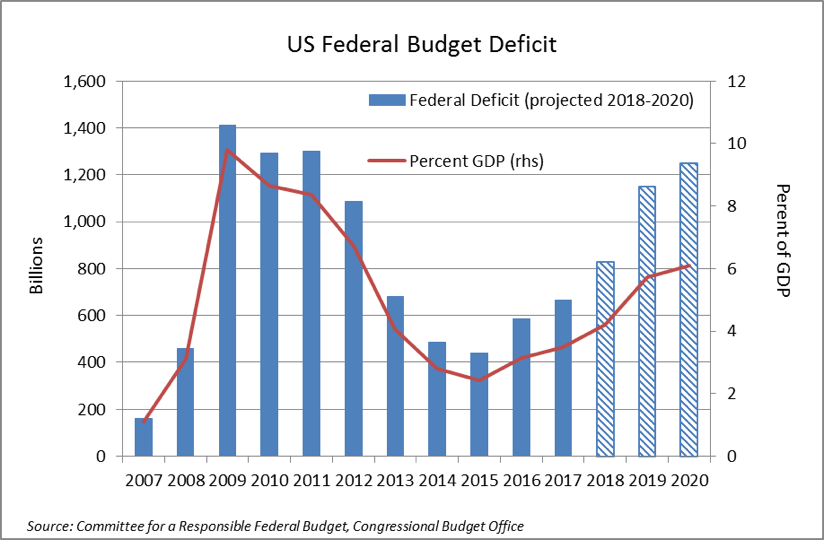
Under potentially more realistic assumptions from the CFRB, the US budget deficit will nearly triple in 2019 from the decade low of $400 billion achieved in 2015 to about $1.2 trillion. Using CFRB assumptions, the Trump plan is expected to produce annual $1.0 trillion deficits for the next 5 years.
To put those deficit figures into context, the annual budget deficit averaged more than $1 trillion during the first four years of the Obama administration (2009-2012). This period was marked by high deficits as the US economy struggled with the after effects of the 2008 financial crises and associated economic recession. By contrast, the current budget proposal anticipates $1 trillion deficits not in a period of economic weakness but in an environment of relatively strong economic growth. Should the economy experience a recession over the next five years, then actual deficits could be much higher than the $1 trillion forecasts.
Likely Implications for the Bond Market – the End of the 35 year Bull Market
When the US ran $1 trillion deficits in 2009 through 2012, the Fed periodically went on a QE buying spree that essentially funded a large proportion of these budget deficits with newly printed money. By contrast, the Fed is currently unwinding it QE program. That means that in 2019 the US Treasury will need to finance $600 billion in maturing QE bonds from the Fed in addition to a $1.2 trillion budget deficit, a total financing requirement of nearly $2 trillion. We do not doubt that the US will be able to fund this additional debt, but believe that longer term interest rates may have to increase more than we originally anticipated in order to do so.
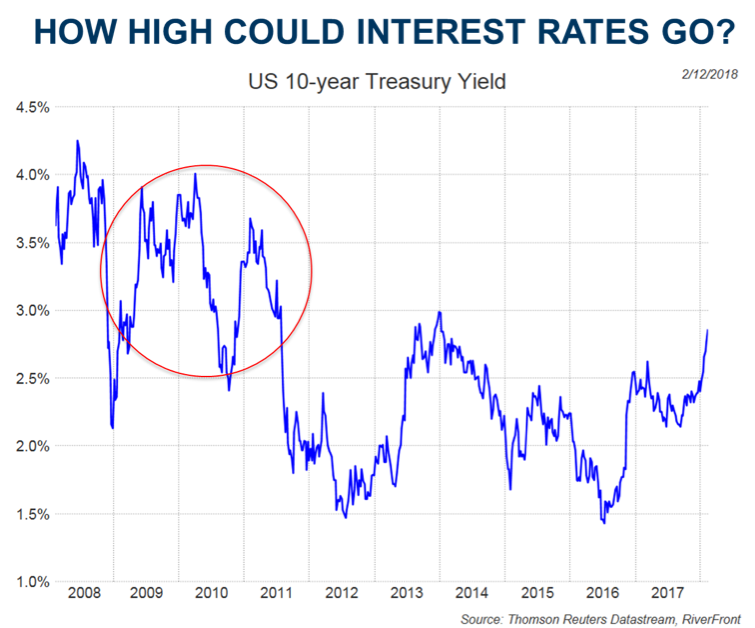
The above chart gives some indication of where longer term interest rates could go as fiscal stimulus hits the economy and additional debt hits the bond market. Our conclusion from studying the prior period of $1 trillion deficits (2009-2012) is that aggressive QE purchases in 2011 and 2012 (“Operation Twist” and “QE Infinity”) were required to push 10-year treasury rates below 2.5%. Absent a concerted Fed effort to drive down long rates through QE, we believe that funding $1 trillion deficits required 10-year treasury rates of between 2.5% and 4.0% when US short rates were close to 0% and the global economy was fairly weak. That is a far more favorable environment for bonds than we anticipate in 2018 and 2019, with the Fed likely to push short rates above 2% and the global economy enjoying its fastest rate of growth since the 2008 financial crises. In that environment, a 2.5% to 4.0% trading range for the 10-year treasury could be considered an optimistic forecast in light of $1 trillion deficits, in our view.
Likely Implications for the Stock Market – Volatility Yes, Bear Market No
Rising rates and the end of QE mean that equity markets will probably return to a normal (much higher) level of volatility, but we do not believe that the end of the long bull market in bonds will signal the end of the current bull market in equities. The chart below shows the relationship between 10-year treasury rates and valuation levels in the equity market, as measured by the Price Earnings (P/E) Ratio (P/E Ratio shows how much investors are willing to pay for a $1 of earnings).

Our analysis of this historical data suggests that as 10-year treasury rates increase from the 1.5% to 2.5% range experienced over the past 3 years (the red circle) to our expected range of 3% to 4% (the green circle), average equity market valuations actually improve. This makes some intuitive sense. When the 10-year treasury yield drops as low as 1.5% to 2.5%, it is often a sign that something is seriously wrong in the global economy. As rates rise from these depressed levels, that usually signals that problems in the economy have improved. A stronger global economy supports equity prices despite higher interest rates. We believe this helps explain why interest rates have not historically depressed equity market valuations until 10-year rates rise above about 6%.
If we are correct that rising rates will not seriously depress equity market valuations, then rising earnings could keep equity markets moving higher. The recently announced fiscal stimulus is likely to accelerate earnings growth, in our view, and any such acceleration will be in addition to the earnings boost provided by tax reform. The recently enacted tax reform bill lowers corporate tax rates to 21%, but preserves many of the tax loopholes and tax avoidance strategies of the old tax code. This has provided a substantial reduction in the tax burden of corporate America, much of which will drop straight into 2018 earnings, in our view. Thus, we believe US equity investors are likely to see sufficient earnings growth to more than offset any headwinds from rising interest rates.
We believe overseas equity investors could have an even better investment environment. Companies with substantial US operations should benefit from accelerating US growth and from a reduced tax burden thanks to US tax reform. At the same time, international markets could avoid the headwind of higher interest rates that we expect in the US. These economies continue to struggle with high unemployment and are unlikely to begin raising rates for some time to come.
Investment Strategy Implications
Fixed income plays a key role for investors that cannot tolerate the volatility of pure equity investments, and the end of the bull market in bonds could expose these investors to risks that financial markets have not experienced for decades.The most important investment implication for these clients to consider is their timeframe for their risk tolerance. As Warren Buffett recently reminded investors in his 2018 letter to shareholders:
“I want to quickly acknowledge that in any upcoming day, week or even year, stocks will be riskier — far riskier — than short-term U.S. bonds. As an investor’s investment horizon lengthens, however, a diversified portfolio of U.S. equities becomes progressively less risky than bonds, assuming that the stocks are purchased at a sensible multiple of earnings relative to then-prevailing interest rates.”
The bond market exposes investors to the risk of having their income and wealth fall behind the rate of inflation over long investment horizons. Investors have not faced this risk, for the most part, during the long bull market in bonds. If we are correct that the bull market in bonds is coming to and end, now may be a good time for investors to evaluate the balance between this long term risk and shorter term equity risks in their portfolios.
