In case you missed it, 2019 was a good year to be an equity investor. Examining market-cap-weighted indices, the U.S. stock market was up ~ 30%, Developed International Markets were up ~ 22%, and Emerging Markets were up ~ 18%.
But how did factors do in 2019?
Below I update my post from last year, examining the performance of simple factor portfolios. This year, I make some minor tweaks to highlight the performance while varying the level of concentration towards each factor.
Let’s dig into the results.
Factor Investing Data and Results
Similar to last year, I examine the holdings of the IWB ETF (~1,000 largest U.S. stocks). 1
The holdings are updated on quarter-end dates (e.g., 12/31/18, 3/31/19, 6/30/19, and 9/30/19), with the factors being calculated on the same dates. Once the holdings and factors are calculated, the holdings are then split into decile portfolios (as well as quintiles, terciles, and halves) and held for 3 months. 2 All portfolios, including the Universe and the Factor Deciles, are equal-weighted. No transaction costs or other fees are applied to any of the portfolios.
Within the portfolios, I examine a variety of common factors:
Factors Analyzed
- Value Investing Factors (5):
- Enterprise Multiple (EBIT/TEV)
- Book-to-Market (B/M)
- Earning’s Yield (Inverse of P/E)
- Cash-Flow to Price (CF/P)
- Sales to Price (S/P)
- Other Investing Factors (5):
- Momentum (12_2) 3
- Size
- Beta
- ROA (Quality) — Return on Assets
- FS Score — Our 10-point Financial Strength Score (very similar to the Piotroski F-Score!). 4
For all variables except Size and Beta, a higher value is considered “better” and thus the firms would be in higher deciles. All returns are total returns and include the reinvestment of distributions (e.g., dividends) .
The Value Factor Results
First, let’s examine the results of the five “Value” factors I described above. Below are the annualized returns to the long/short portfolios for the five respective Value factors. The x-axis represents the 2019 compound annual growth rate (CAGR), with the y-axis representing (1) the different Value measures and (2) levels of concentration.
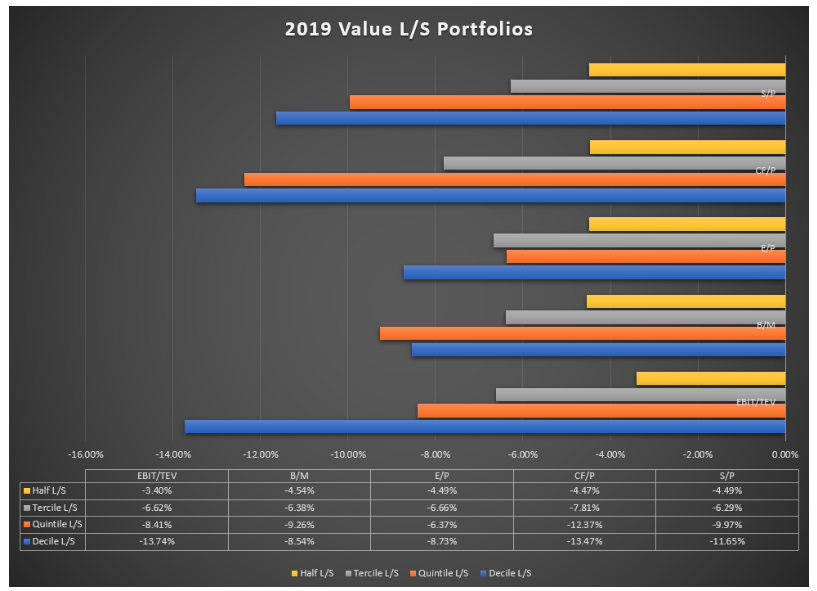
What one notices immediately is that none of the Value factors had a positive return in 2019. None. No matter which measure was used, nor at any concentration level.
In other words, 2019 was another rough year for Value investors.
New to the analysis in 2019 is the varying levels of “concentration” to each Value factor. For example, the Decile performance is going to be long/short the top/bottom decile on each measure. If we assume we have 1,000 firms, this means we are long 100 firms and short 100 firms. Compare this to the “halves” portfolio, whereby the portfolio is long the top half and short the bottom half–in our example of 1,000 firms, the portfolio is long 500 stocks and short 500 stocks.
Examining the results above, one notices, not surprisingly, that when one makes a more concentrated bet to a factor that isn’t working well, the performance is even worse.
Simply examining the EBIT/TEV factor, below are the CAGRs with varying levels of concentration:
- Half (least concentrated) = -3.40%
- Tercile (1/3s) = -6.62%
- Quintile (1/5s) = -8.41%
- Decile (most concentrated) = -13.74%
As seen above, a more “watered-down” approach would have been better in 2019. These results highlight one of the downsides of more concentration; however, it should be noted that concentration can be “good” if the factor is “working.” These results are similar to the analysis I did in the middle of last year, examining Value investing and concentration.
However, most factor investors use long-only funds for their investment portfolios, as opposed to long/short funds. 5 So below I show the results to the “top” portfolio and the “bottom” portfolio on each Value measure while varying the concentration level. 6
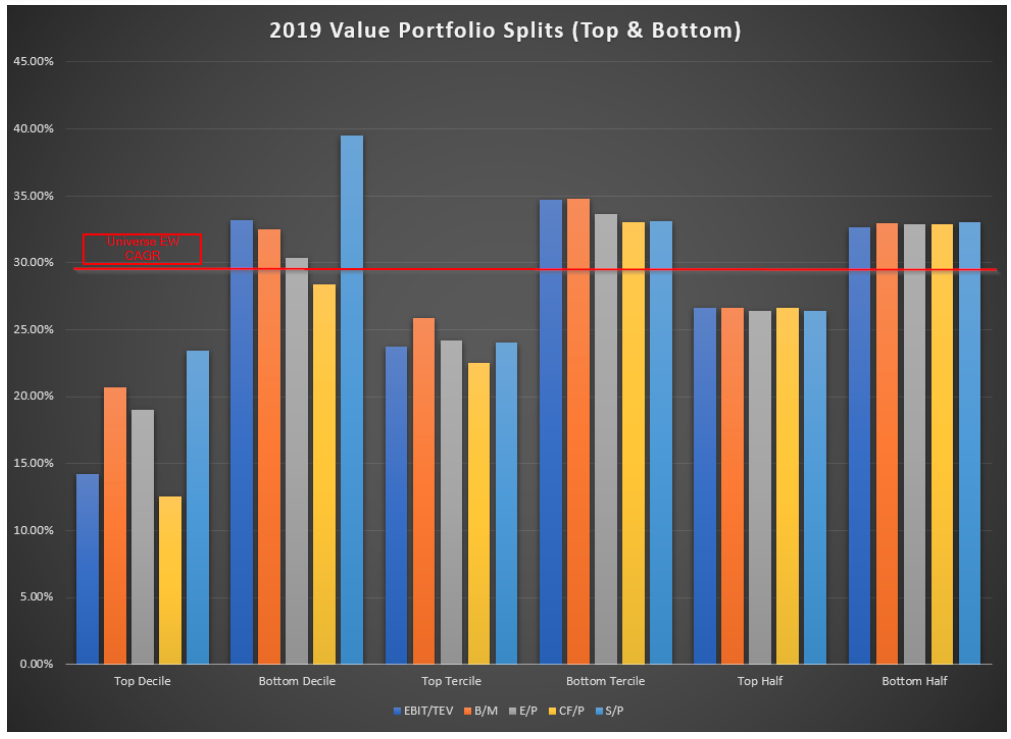
Here, the y-axis represents the compound annual growth rate (CAGR) for each portfolio, while the x-axis varies (1) the value measures and (2) the concentration level.
Maybe surprisingly, after viewing the long/short portfolio results above, all of the portfolios had a positive return in 2019!
What one notices is that the more concentrated “top” portfolios did significantly worse than the equal-weighted universe return, as well as compared to their corresponding “bottom” portfolios. As we move from left to right, we notice, not surprisingly, that as our portfolio becomes more and more like the market (i.e. picking the top 500 Value stocks as opposed to the top 100 Value stocks), the returns become closer to the market.
Thus, the results above highlight the effects of concentration within “value” portfolios.
So overall, within the U.S., Value had a bad year no matter how one picked cheap stocks. However, for long-only investors, at least it was a “positive” returning year. For those recommending to buy the decile of firms with the highest Sales/Price ratio (i.e. the most expensive on this measure), congrats for the great 2019 performance!
But what about the other non-Value factors mentioned above? How did they perform?
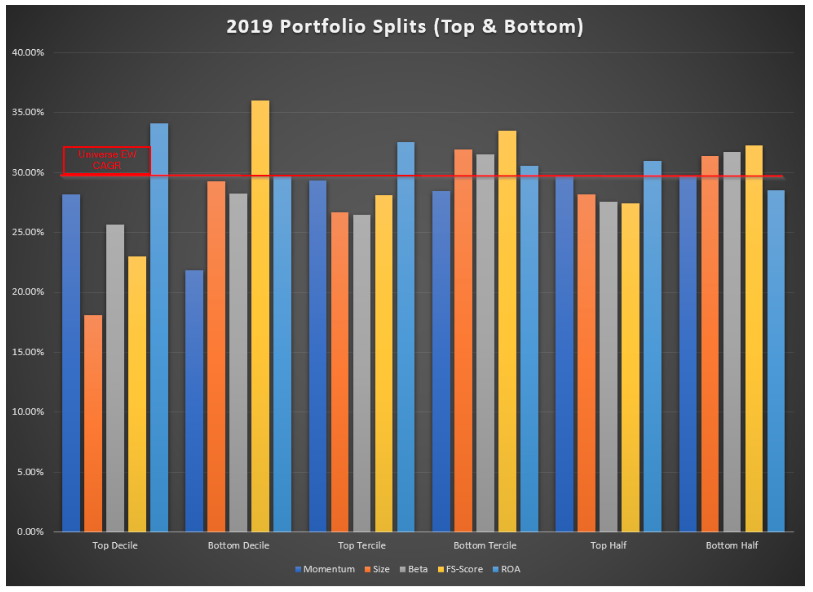
Below I run a similar analysis on the other 5 factors: Momentum, Size, Beta, ROA, and FS-Score. Similar to the analysis above for Value portfolios, I vary the concentration levels for each factor.

What one notices is that with the exception of ROA, all of the factors had negative returns. Combined with the results for Value above, 2019 was a bad year for factor investors. 7
In general, the concentration results are similar as shown above for Value–if the factor was not working, more concentration simply amplified the pain.
However, since most investors are invested in long-only funds, let’s examine the returns to the “good” and “bad” portfolios, in other words, the “long” and the “short” portfolios. So below I show the results to the “top” portfolio and the “bottom” portfolio on each Factor measure while varying the concentration level. 8
Conclusion
In 2019, all Value measures failed, and save ROA, the other factors failed as well. However, for long-only factor investors, at least 2019 was a positive year from a return standpoint.
When examining the effect that concentration has on factor returns, one finds that if a factor is not working, taking a more concentrated bet on that factor would have been painful. While we have examined the effects that concentration can have both within Value and Momentum in the past (on paper portfolios), the results above highlight that while one may prefer to take more concentrated bets in Value and Momentum, it can be painful over the short-run.
It should be caveated that this is only examining stocks that were, at one point in time, within the IWB ETF (~1,000 largest firms). In addition, managers and funds generally (1) hold more or fewer stocks, (2) use different weighting schemes, (3) use different rebalance dates, (4) combine or use multiple signals, and (5) may invest in stocks outside of this universe. Thus, this cannot fully explain all the returns to factor portfolios, but it is a start.
Have a great 2020! 9
Notes:
- Obviously, results would change if we changed the starting universe. ↩
- All data and calculations are done by FactSet. Fundamental data is lagged 3 months to avoid a “look-ahead” bias. ↩
- The twelve-month total return excluding the prior month. ↩
- The FS-Score variable also has EBIT/TEV/100 added to its FS-Score value in order to break any “ties”. ↩
- To be clear, the results above are the returns to long/short portfolios! ↩
- For ease of exposition, I have excluded the quintile results. ↩
- As Cliff Asness mentioned in 2018 (yes, so there has been another bad year for factor investing!), the good portfolio, from a 2019 performance standpoint, would be the so-called “Costanza portfolio” whereby everyone picks the opposite of everything they been taught as factor investors. ↩
- Similar to Value, I have excluded the quintile results in order to make the results easier to read. ↩
- I wish this was written earlier in the year! ↩
