![]() By Eric Legunn, CFA, Deutsche Asset Management
By Eric Legunn, CFA, Deutsche Asset Management
A few months ago I wrote a blog to help investors better understand the quality factor. As shown below, year-to-date the Russell 1000 Quality Factor Total Return Index has outperformed not only the Russell 1000 Total Return Index, but also the Russell 1000 Value, Size, Volatility and Momentum Factor Total Return Indexes. This is a noteworthy result that deserves attention. So, today I would like to revisit the quality factor to explain how it aims to pick individual securities within a smart-beta exchange traded fund (ETF).
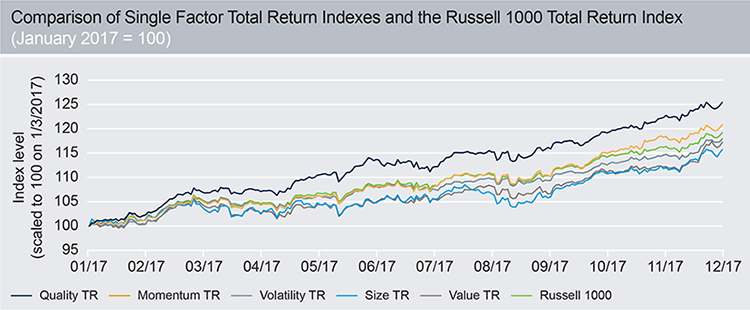
Source: Bloomberg for the period of 1/3/2017 through 12/8/2017. Past performance is no guarantee of future results.
What is the quality factor? Definitions for quality vary across the investment industry. At Deutsche Asset Management, we partner with FTSE Russell to define the quality factor in terms of high and persistent profitability in conjunction with low leverage. When it comes to profitability, the quality factor assesses a company’s return on assets (ROA), change in asset turnover (CTO), and level of accruals (ACCR). These three metrics gauge both the level and persistence of a company’s profitability. On the other hand, a ratio of operating cash flow to total debt is used to assess a company’s leverage. In a typical application of the quality factor, these metrics are calculated for all 1000 companies in the Russell 1000 and an overall quality score is calculated for each security. The quality score is calculated using a 50% emphasis on profitability (which is further subdivided into equal 33% weightings on ROA, CTO, and ACCR) and a 50% emphasis on leverage. Companies that exhibit the highest quality scores are more heavily weighted in a portfolio that aims to capture the quality factor, while companies that exhibit the lowest quality scores are least heavily weighted. To gain a better understanding of this, let’s take a look at an example that compares two hypothetical companies from a quality standpoint: brand-name Company X and unknown Company Y. The quality factor compares these two companies on the basis of ROA, CTO, ACCR, and leverage. Consider Company X and Company Y. How does the quality factor choose which one to overweight or underweight in our portfolio? Table 1 lists financial data for these companies:
Table 1:

1.) For illustrative purposes only. Data shown is purely hypothetical and does not represent any particular product or security. ‘t’ indicates this year, ‘t-1’ indicates last year.
