
By Kristen Perleberg, The Leuthold Group
March 2019
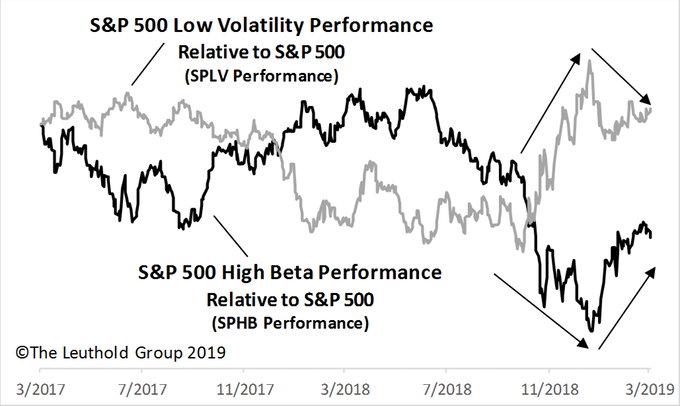
Equity markets have experienced large, trending performance swings of late, contributing to big relative strength moves for stocks possessing high and low beta and volatility characteristics. Stocks with high beta and volatility profiles plummeted on a relative strength basis in the final quarter of 2018, but as of the late-2018 market lows, they have reversed aggressively to the upside (Chart 1). Two popular benchmarks that gauge beta and volatility performance are S&P 500 High Beta and S&P 500 Low Volatility Indexes. Since December 24th, the former is up 26.8% (SPHB ETF) compared to the S&P 500’s +19.3% total return (through March 4th). Meanwhile, S&P 500 Low Volatility is up 16.3% (SPLV ETF).
Chart 1
These indexes’ strategies are employed through popular investment vehicles; each is an aggressive approach for investors wishing to express their views for either factor’s future returns. These assertive approaches, however, may not be suited to many investors. Our equity research typically focuses at the industry group level, thus in this article, we explore these factors’ behaviors from the stance of our 111 proprietary industry groups. Whether one has a specific view on beta’s future returns… or if one prefers to avoid making a bet in either direction, here we present industry groups—across eleven sectors—that fit each of those viewpoints. By employing a different perspective to analyze our multi-factor group model, we aim to discover new investment ideas.
Risky Business
Chart 2 & 3
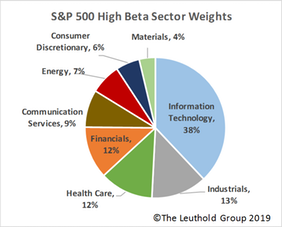
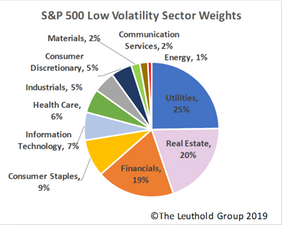
S&P 500 High Beta and Low Volatility Index methodologies are straightforward. Using trailing twelve-month data for each strategy, the former invests in the S&P 500’s 100 highest beta stocks; the largest weights are applied to those with the highest betas. The latter index invests in the 100 lowest volatility stocks, with higher weights placed on the least volatile stocks. A major fault with these methodologies is that each inherently makes huge sector and industry bets. For example, the S&P 500 High Beta Index (Chart 2) currently has a 38% weight in Info Tech (almost twice that of the S&P 500); within that sector, the highly cyclical Semiconductor and Semi Equipment industry groups constitute nearly a 16% weight, four times the corresponding S&P 500 weight. Additionally, three sectors are absent from the high beta index. The low volatility index currently captures all eleven sectors (Chart 3), but particular exposures are again enormous, with Utilities and Real Estate comprising a 45% weight; this is seven times that held in the S&P 500.
Our industry-group betas and volatility calculations are similar to that employed by S&P, except we utilize price data that’s already been aggregated to the group level. Beta and volatility measures are similar but not the same; beta measures a stock or group’s sensitivity to movements in the broad market, while volatility is simply measuring the standard deviation of daily price returns. At the group level, these two factors are highly correlated, so we honed in on beta for this research.
Beta, by definition, often works well in trending markets such as those we’ve been experiencing lately (e.g., high beta rises faster in a rising market and falls faster in a falling market). This has indeed been the case, recently, at both the stock and industry group level. Given the S&P indexes’ huge sector exposures, we were curious to see how the group betas behaved within each sector. Because we track only 111 groups among eleven sectors, within each sector we divide the groups into just two buckets: higher beta and lower beta. Table 1 looks at the two periods of double-digit market swings over the past six months. In all but one instance (highlighted, Table 1), within each sector, the average returns of the higher beta segment outperformed [underperformed]those of both the overall sector and the lower beta division during a rising [falling]market.
Table 1
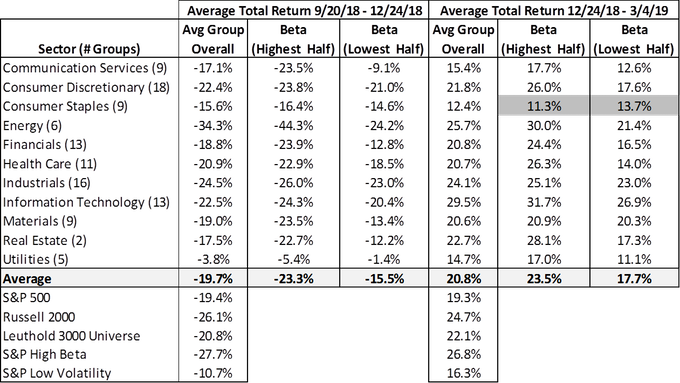
We examined additional periods of double-digit gains/losses over the past several years and saw similar results, with higher versus lower beta groups performing as expected (or better) across 70% of the sectors. Typical areas where beta didn’t always hold up were in defensive sectors such as Consumer Staples and Health Care. There are periods, of course, where this is not the case. For example, beta did not work well across many sectors during the double-digit market gains leading up to the September 2018 all-time market top. However, over that period our group betas did work well across Staples, Health Care, Utilities, and Telecom—sectors with very little representation in the S&P 500 High Beta Index.
Industry Group Ideas by Sector
Of course, taking a relatively more sector-neutral approach to beta and volatility investing will not likely give one the same result as having 40% exposure to high beta IT in a swiftly rising market environment. It nevertheless allows for a more diversified and conservative way to express a view. This approach will also likely leave one less bruised when market trends change course. Further, investing at the industry group level allows one to capture beta via a basket of stocks, rather than just one.
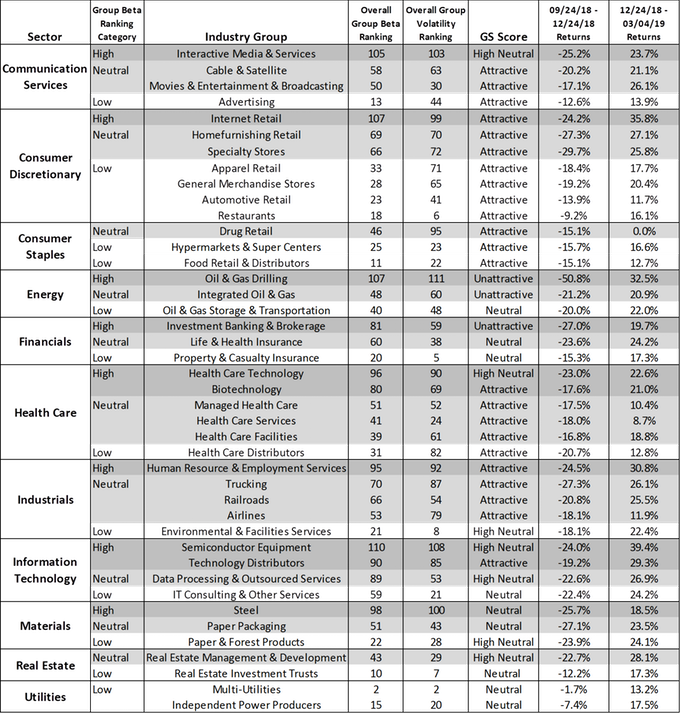
Table 2 is a list of industry group ideas by sector. We divided groups into beta “categories” based simply on the group’s current beta ranking among all 111 industries (top, middle, bottom = high, neutral, low). We’ve included all Attractively-rated groups (meaning their GS Scores rank in the top quintile of groups based on our multi-factor model). Note that we’ve filled in many gaps with non-Attractively-rated groups, as some sectors currently have no underlying industries that rank well via our GS Scores.
Table 2
About the Author
Kristen Perleberg Sr. Research Analyst & Co-Portfolio Manager
Kristen is a Senior Analyst and Co-Portfolio Manager of the Grizzly Short Fund.
© 2019 The Leuthold Group