![]() When investors talk social networking sites, they want to know about MAU. Monthly Active Users or MAU is a key metric used to analyze social networking companies. Investors often apply MAU instead of Daily Active Users (DAU) for comparison purposes because more companies typically report MAU.
When investors talk social networking sites, they want to know about MAU. Monthly Active Users or MAU is a key metric used to analyze social networking companies. Investors often apply MAU instead of Daily Active Users (DAU) for comparison purposes because more companies typically report MAU.
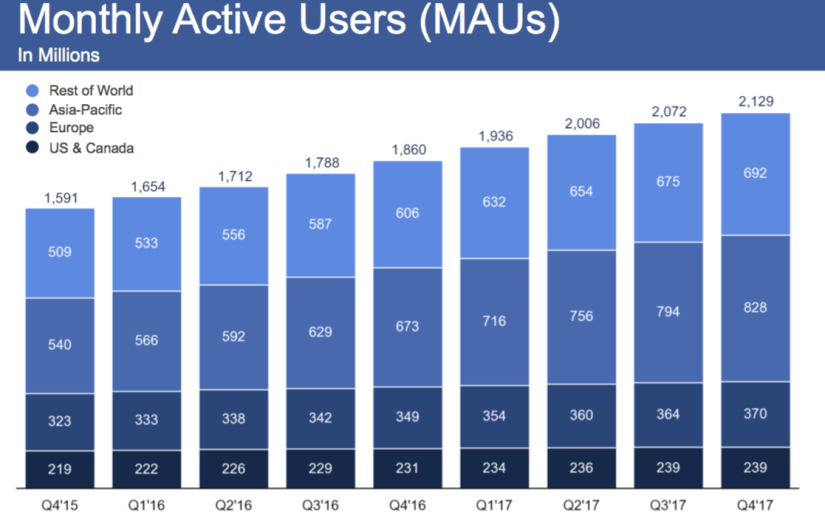
Facebook (NASDAQ: FB) boasts 2.1 billion MAU which grew by 269 million in FY 2017. As illustrated in the chart below, 90% of that growth came from Asia-Pacific and Rest of World Regions.
![]()
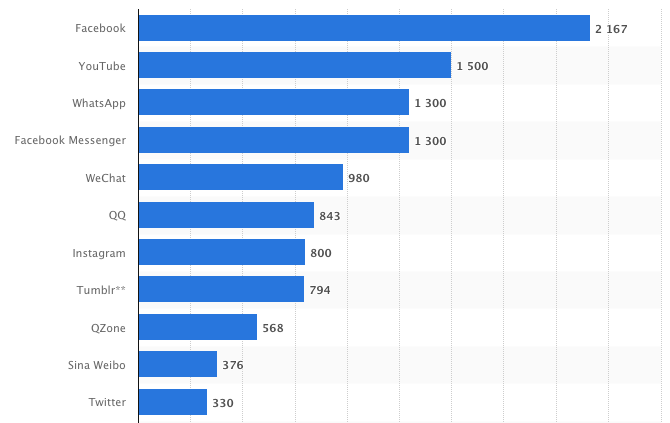
The numbers above are impressive. Facebook calls 28% of the world’s population Monthly Active Users. The comparison with other social networking sites makes those numbers stand out further. In addition, Facebook owns WhatsApp, Instagram, and Messenger which post substantial MAU figures as well. As the chart below shows, Facebook and its subsidiaries hold 4 out of the top 7 spots in terms of MAU.
![]()
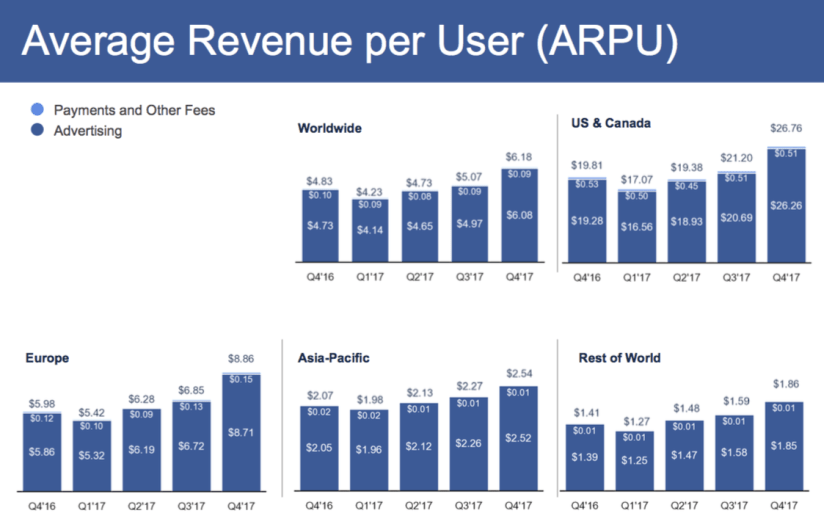
Average Revenue per User
Now that we know how many users Facebook has, it’s time to find out how much revenue each user generates. According to the numbers from Q4 2017, the Average Revenue Per User from the US and Canada region was $26.76, up 35% from prior year. While the next highest, is from Europe at $8.86, up 48% YoY. The Asia-Pacific region posted $2.54 which was up 23%.
![]()
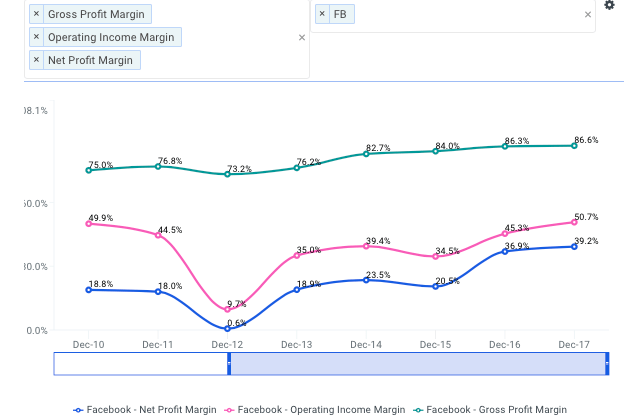
Gross, Operating, and Net Profit Margins
Facebook’s margins are robust to say the least. A gross profit margin above 80% is remarkable. Operating income margin has seen dramatic growth over the past five years climbing from 9.7% in FY 2012, to over 50% in FY 2017.
Net profit margin has also seen astronomical growth going from 0.6% in FY 2012 to 39% in FY 2017. There is evidence of economies of scale in operating profit margin. As gross profit margins have held relatively stable, the increases in revenue has led to a significant increase in operating profit margin.
![]()
Facebook’s Historical Revenues
Facebook achieved revenues of $40 Billion in FY 2017, a 47% increase compared to FY 2016. In Q4, total ad revenue reached $13 billion up 44% YoY. The big driver in sales was an increase in the average price per ad, which was up 43% in Q4 from prior year while ad impressions were only up by 4%.
By limiting the amount of available ad impressions, Facebook was able to earn higher prices per each individual ad. In addition, the company develops tools to help businesses target specific customers. These targeting and re-targeting tools help increase the conversion rates for ad impressions and demands a premium from marketers who wish to employ it.
![]()

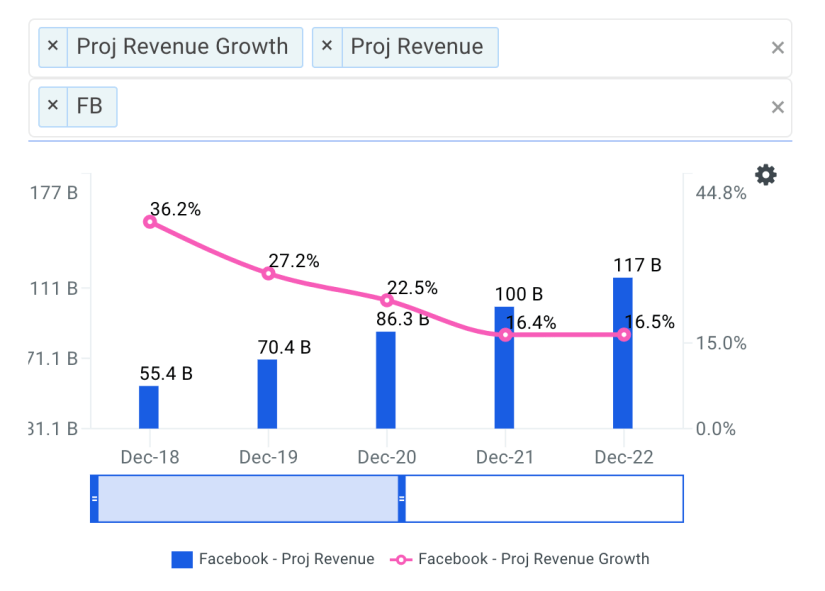
Projected Revenues and Growth Rates
As the market becomes saturated, Facebook’s top-line growth rate is projected to decline. However, Wall Street analysts still expect sales to grow at no less than 15% for the next five years. Management has confirmed they expect growth to decelerate but have not given specific numbers. According to the Wall Street’s forecast, Facebook will hit $100 billion in revenues in the FY 2021.
![]()
Investing in Growth
Facebook announced in its most recent conference call that Capital Expenditure will be between $14-$15 billion for FY 2018. This would more than double the roughly $7 billion in CapEx for FY 2017. The increase will be driven by investments in data centers, servers, office facilities, and network infrastructure. However, this could be seen as a bullish sign for investors considering Facebook’s cash return on invested capital is above 20%.
