
What makes the current market environment so strange is that while stock and bond valuations have historically been negatively correlated, they became simultaneously cheap in the 1980s and are now simultaneously expensive.
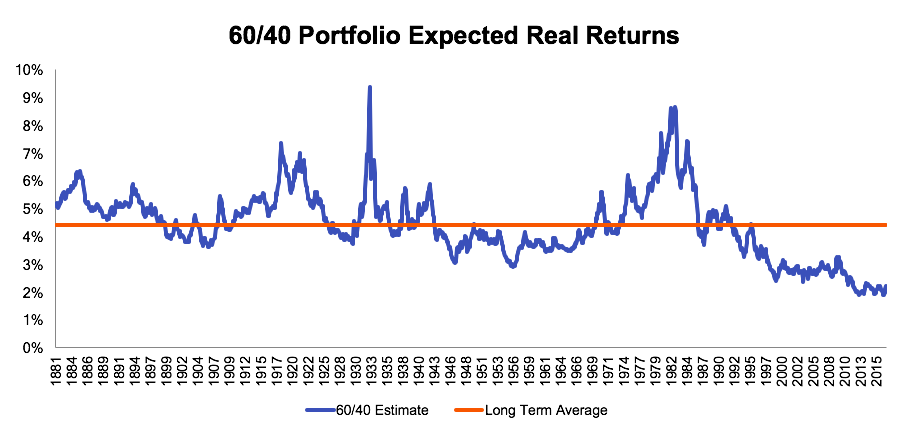
While the negative correlation allowed a traditionally constructed 60/40 stock/bond mix to provide a semi-constant expected return profile (or, at least, a reasonably floored one) from 1880-1970, the post 1970 period has seen the portfolio shift from very cheap to very expensive.
This means that the outlook for a 60/40 portfolio today is near the lowest it has ever been: our rough math puts the real-return near 2.2%.
“My dear, here we must run as fast as we can, just to stay in place. And if you wish to go anywhere you must run twice as fast as that.”
There is a significant danger of low expected returns for financial planning. Old rules – using a 60/40 portfolio with a 4 or 5% withdrawal rate – may no longer be safe. We highlighted this risk in our recent commentary Impact of High Equity Valuations on Safe Withdrawal Rates. Below are two graphs from that commentary. In the first, the historical results of applying a 4% withdrawal rate to a 60/40 stock/bond allocation. In the second, the same rules applied, but historical results are adjusted downward such that the long-term average return matches the future long-term expected returns.
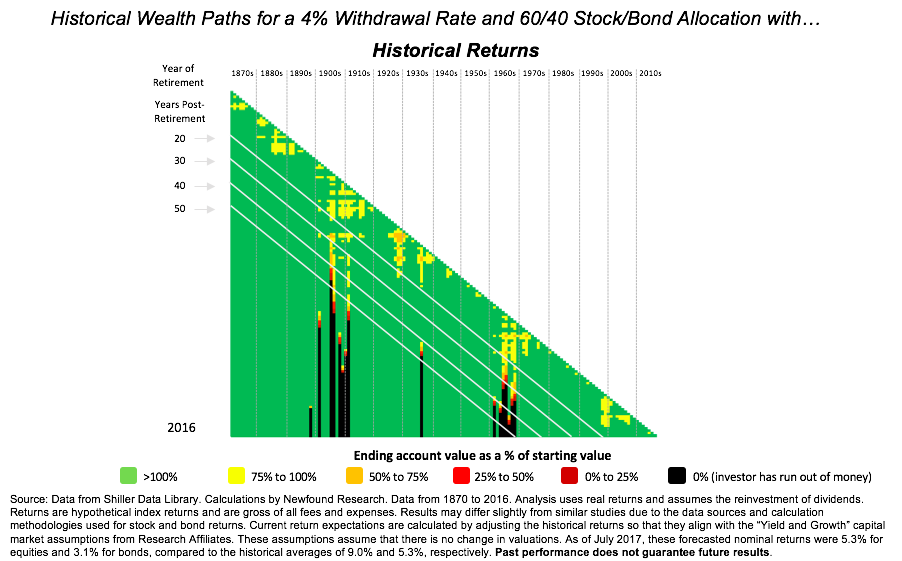
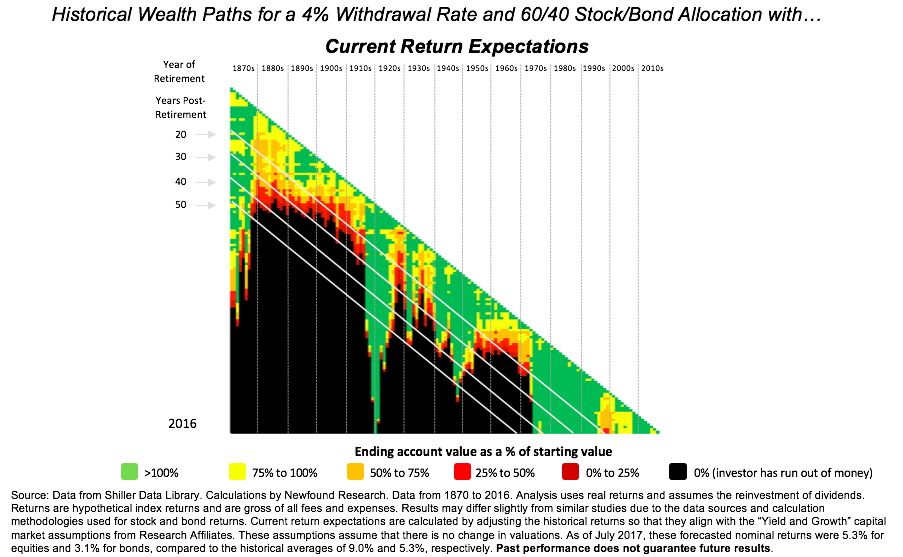
We see that what was once safe may no-longer be. There is no silver bullet to this problem. Rather, a number of solutions will likely be necessary. While we will be writing several follow-up articles in the coming weeks, some immediate ideas for dealing with this problem are:
- Increased savings rates during accumulation.
- Significantly reducing fees during retirement.
- Dynamic withdrawal plans.
- Active risk-management plans to address sequence risk.
- Looking outside traditional stocks and bonds for other return generators.
The Weird Portfolio
Fortunately, one of the many positive trends of the last two decades has been the down-stream movement of many asset classes and investment styles once relegated to the world of accredited investors, into low-cost, liquid fund packaging. Exposures like levered loans and emerging market debt, and strategies like equity long/short and global macro, are now available for investor use to complement a traditionally allocated stock/bond portfolio.
If J.P. Morgan’s outlook is right, these types of positions may be more important today than ever before.
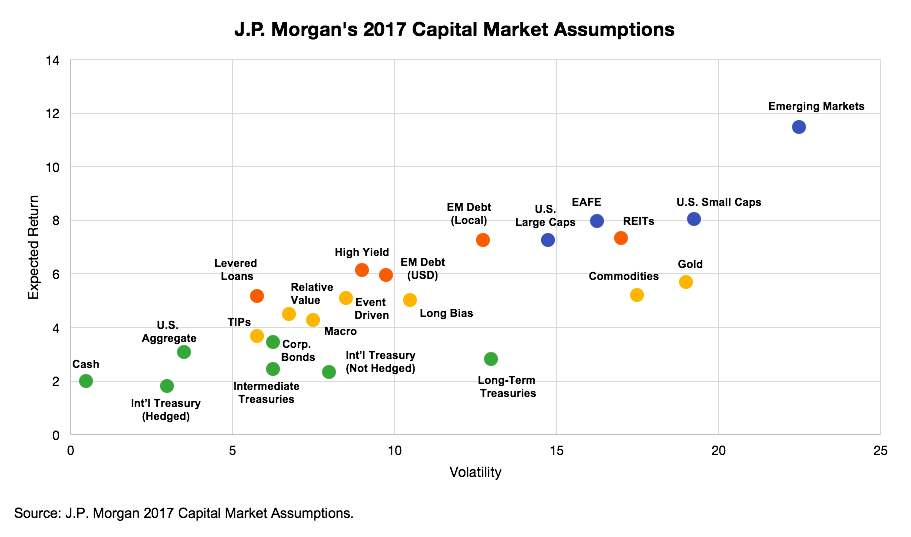
Plotting expected return versus risk allows us to see that positions like U.S. Large Cap equities and U.S. Aggregate Bonds may no longer be attractive. Rather, positions like U.S. Small Caps, Emerging Market Debt (Local Currency), and Levered Loans may provide much more bang for the investment buck.
One of our favorite exercises is to take capital market assumptions like these and run them through a traditional mean-variance optimization, targeting the same risk profile of a standard 60/40 stock/bond mix.[2] Unlike us, the optimizer has no attachment to a particular asset class: it simply looks to maximize return for our stated risk target.
The result, today, is a pretty weird looking portfolio.
![Plotting expected return versus risk allows us to see that positions like U.S. Large Cap equities and U.S. Aggregate Bonds may no longer be attractive. Rather, positions like U.S. Small Caps, Emerging Market Debt (Local Currency), and Levered Loans may provide much more bang for the investment buck. One of our favorite exercises is to take capital market assumptions like these and run them through a traditional mean-variance optimization, targeting the same risk profile of a standard 60/40 stock/bond mix.[2] Unlike us, the optimizer has no attachment to a particular asset class: it simply looks to maximize return for our stated risk target. The result, today, is a pretty weird looking portfolio.](https://www.etftrends.com/wp-content/uploads/2017/09/Figure-9-The-Weird-Portfolio.png)
(We should note that if we perform the same exercise using capital market assumptions from BNY, BlackRock, or Research Affiliates, the results are very similar).
We see:
- Despite targeting the same risk profile of a 60/40 portfolio, traditional equities and bonds only make up about 1/3rd.
- U.S. large-caps and U.S. aggregate bonds are almost nowhere to be found.
- Equity exposure is dominated by emerging market and U.S. small-cap exposure.
- Bond exposure is almost entirely long-dated U.S. Treasuries. This may seem odd, given that long-term Treasuries offer one of the worst risk-reward trade-offs according to J.P. Morgan’s outlook. However, J.P. Morgan’s correlation assumptions make them an incredible diversifier to increased volatility of the equity sleeve.
- Traditional “return generators” are largely replaced by credit-like exposures (e.g. high yield bonds, levered loans, emerging market debt, and REITs).
- Traditional “risk mitigators” are largely replaced by diversifying alternative exposures.
We’ll be the first to admit that almost no investor would be willing to actually hold this portfolio. With nearly 25% of the portfolio in gold and long-term U.S. Treasuries, the tracking error alone would drive most investors mad.
And all just for what amounts to a 1% bump in expected return. While 1% may not seem like much, in a low-return world it is nearly a 25% increase from a traditional stock/bond mix.
While few would feel comfortable implementing this weird portfolio outright, we believe that this exercise provides at least a hint of guidance for investors today: thinking outside the box may be necessary going forward.
Conclusion
“But I don’t want to go among mad people,” Alice remarked.
“Oh, you can’t help that,” said the Cat: “we’re all mad here. I’m mad. You’re mad.”
“How do you know I’m mad?” said Alice.
“You must be,” said the Cat, “or you wouldn’t have come here.”
Corey Hoffstein is the Co-founder & CIO at Newfound Research, a participant in the ETF Strategist Channel.
[1] See For Constant-Duration or Constant-Maturity Bond Portfolios, Initial Yield Forecasts Return Best near Twice Duration by Gabriel Lozada for technical details.
[2] Technically, we run a simulation-based mean-variance optimization in effort to account for estimation risk and come up with a more stable allocation profile.
