
![]() By Corey Hoffstein, Newfound Research
By Corey Hoffstein, Newfound Research
Portfolios in Wonderland
“Begin at the beginning,” the King said, very gravely, “and go on till you come to the end: then stop.”
At the beginning of each year, many institutions publish their capital market assumptions, providing an outlook for expected returns, volatilities, and correlations. These glossy brochures go well beyond data, however, and often veer wildly into what we like to call macro tourism: data-based market prognostications about macro-economic conditions and their implications for markets.
Unfortunately, for most investors, while macro tourism makes for an entertaining read, the track record of most predictors is quite poor. Simply put, markets do not behave in the linear, domino-like fashion that most predictions are laid out as. There are simply too many non-linear relationships to make accurate predictions; it is like trying to predict the exact weather in Boston a year out.
That said, if we are willing to restrain ourselves, meaningful forecasts can be made. We may not be able to predict the exact weather, but there is a good chance the temperature will be between 65℉ and 80℉.
While exact predictions may be futile, evidence suggests that by taking a long-term view (7-10 years) and focusing on stable variables, we can make similar long-term forecasts for most major asset classes. For U.S. investors, simply getting an understanding of what will likely happen with U.S. stocks and bonds can provide a tremendous amount of insight for the rest of our financial plan.
So, let’s begin with U.S. equities. Here, we turn to the Shiller CAPE. For those not familiar yet with this metric, it is a 10-year smoothed price-to-earnings measure for the U.S. equity market. The aim of smoothing over 10-year periods is to get a measure that is less sensitive to market cycles, creating a “cyclically-adjusted” P/E (“CAPE”).
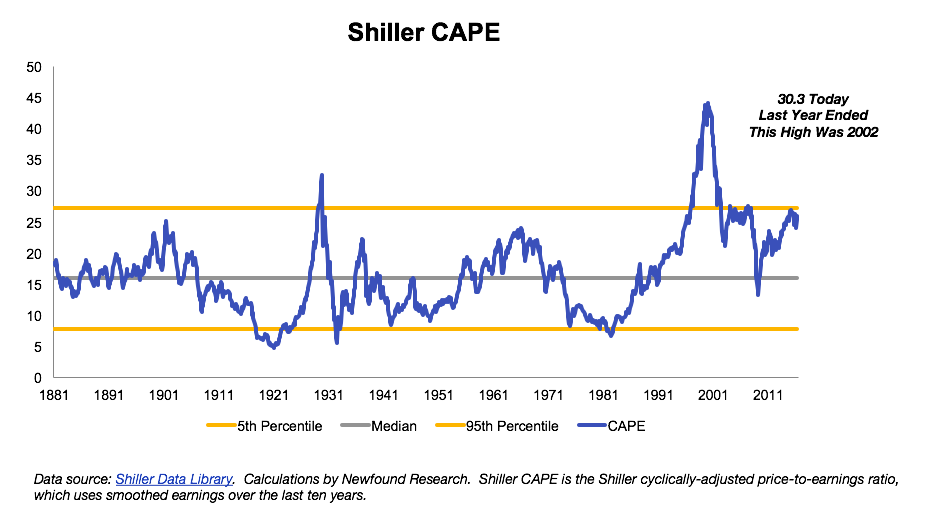
We can see that today’s CAPE is highly elevated compared to past measures.
The implication of a high CAPE reading is that stocks are expensive: you are paying more per unit of fundamental value.
In our piece Anatomy of a Bull Market, and the subsequent follow-up, we demonstrated that over the long-run, valuation changes have contributed little to U.S. equity performance. While they can vary wildly in the short-run, they have historically exhibited mean-reverting behavior: cheap tends to get more expensive, and expensive tends to get cheaper.
In the short-run (7-10 year periods), however, valuation changes can have a very meaningful impact on returns. Where the Shiller CAPE sits today, if real earnings grew at 2% a year, the market would have to return 0% for the next 13 years for the Shiller CAPE to revert back to its long-term average. Even if earnings accelerate and grow at 4% a year, it would still take nearly a decade of 0% returns.
The other option, of course, is that we experience a bear market and price falls fast enough to cause the Shiller CAPE to revert. A 30% decline in prices would just-about do it.
Now, we’re not here to forecast gloom and doom. Rather, we believe there are a few simple, potential answers. One is that Shiller CAPE is simply the wrong measurement of valuation. Another is that this time really is different: valuations, for a variety of reasons, are simply structurally higher and will remain that way. Or, we could simply argue that we expect market returns to be lower than average going forward, allowing earnings to catch up.
If we “hope for the best and prepare for the worst,” assuming the latter case is prudent. Using earnings growth, dividend yield, and valuation figures, we can forecast expected equity returns over the next 7-10 years. The current estimate – around 3.5% after inflation – is incredibly low by historical standards.

Estimating the expected future return for bonds is much easier. Buying a bond today and holding it to maturity ensures that you lock in the yield-to-worst, regardless of what happens with interest rates.
What about bond funds? For most funds – which are near constant maturity/duration in nature – changing rates have not made as large an impact as most people might assume. This was the topic of our prior commentary Did Declining Rates Actually Matter?, whose results are depicted below.
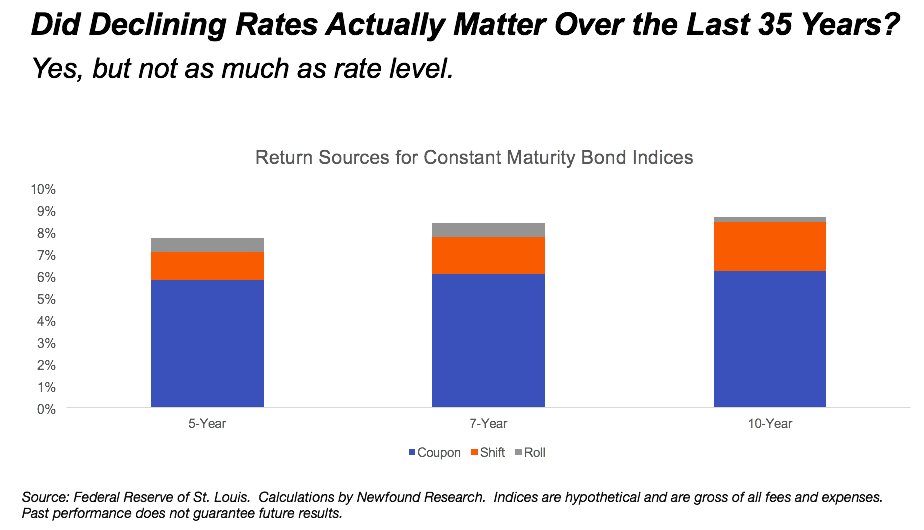
What we find is that while declining rates did have an impact on bond index returns, the vast majority of the return was due to the actual coupon level itself. In other words, what we should focus on, in the current environment, is not trying to accurately predict whether rates will go up or down, but rather the coupon yield we will be receiving.
Which is, today, incredibly low.
“Why, sometimes I’ve believed as many as six impossible things before breakfast.”
Believing that traditional core U.S. fixed income will deliver a return profile anything close to what they have historically delivered is misguided at best. We can actually use a very simple rule – the “2x duration minus 1” rule – to forecast bond fund returns. This rule is highly useful because it is derived to provide guidance regardless of what interest rates do.[1]
Simply, we take the current year and add to it 2x the duration of the bond fund and subtract one. This provides us the forecast year. The current yield-to-maturity – or, yield-to-worst – is then our estimate through that year.
| Asset | Yield to Maturity | Duration | Through | Predicted Nominal Return | Predicted Real Return |
| U.S. Aggregate Bonds | 2.59% | 5.7 | 2028 | 2.59% | 0.29% |
| 1-3 Yr. Treasuries | 1.37% | 1.9 | 2020 | 1.37% | -0.93% |
| 3-7 Yr. Treasuries | 1.91% | 4.5 | 2025 | 1.91% | -0.39% |
| 7-10 Yr. Treasuries | 2.34% | 7.5 | 2031 | 2.34% | 0.04% |
| 10-20 Yr. Treasuries | 2.55% | 10.0 | 2036 | 2.55% | 0.25% |
| 20+ Yr. Treasuries | 3.00% | 17.3 | 2050 | 3.00% | 0.70% |
| IG Corporates | 3.53% | 8.2 | 2032 | 3.53% | 1.23% |
Source: iShares. Calculations by Newfound Research. Figures as of June 2017.
It should be no surprise, then, that forecasted U.S. aggregate real returns are near all-time lows.

