
Economic indicators are released every week to help provide insight into the overall health of the U.S. economy. In this article, we examine indicators from the past week, such as inflation, that shed light on both inflationary trends and sentiment within the market. Policymakers and advisors closely monitor economic indicators to understand recession risk and the direction of interest rates, as the data can ultimately impact business decisions and financial markets. In the week ending on July 13th , the SPDR S&P 500 ETF Trust (SPY) rose 2.25% while the Invesco S&P 500® Equal Weight ETF (RSP) was up 3.25%.
During their last meeting, the Fed voted to leave interest rates unchanged, however indicated they were planning on two more rate hikes for 2023. With the next meeting slated for the end of July, uncertainty remains high for what’s ahead for the second half of 2023. This is why the timing of the VettaFi Fixed Income Symposium, on July 24, is ideal. For three hours, VettaFi will be moderating a discussion of ETF industry experts on a range of topics. In addition to CE credit, advisors will hopefully be better equipped to navigate the challenging bond market and understand their income alternatives.
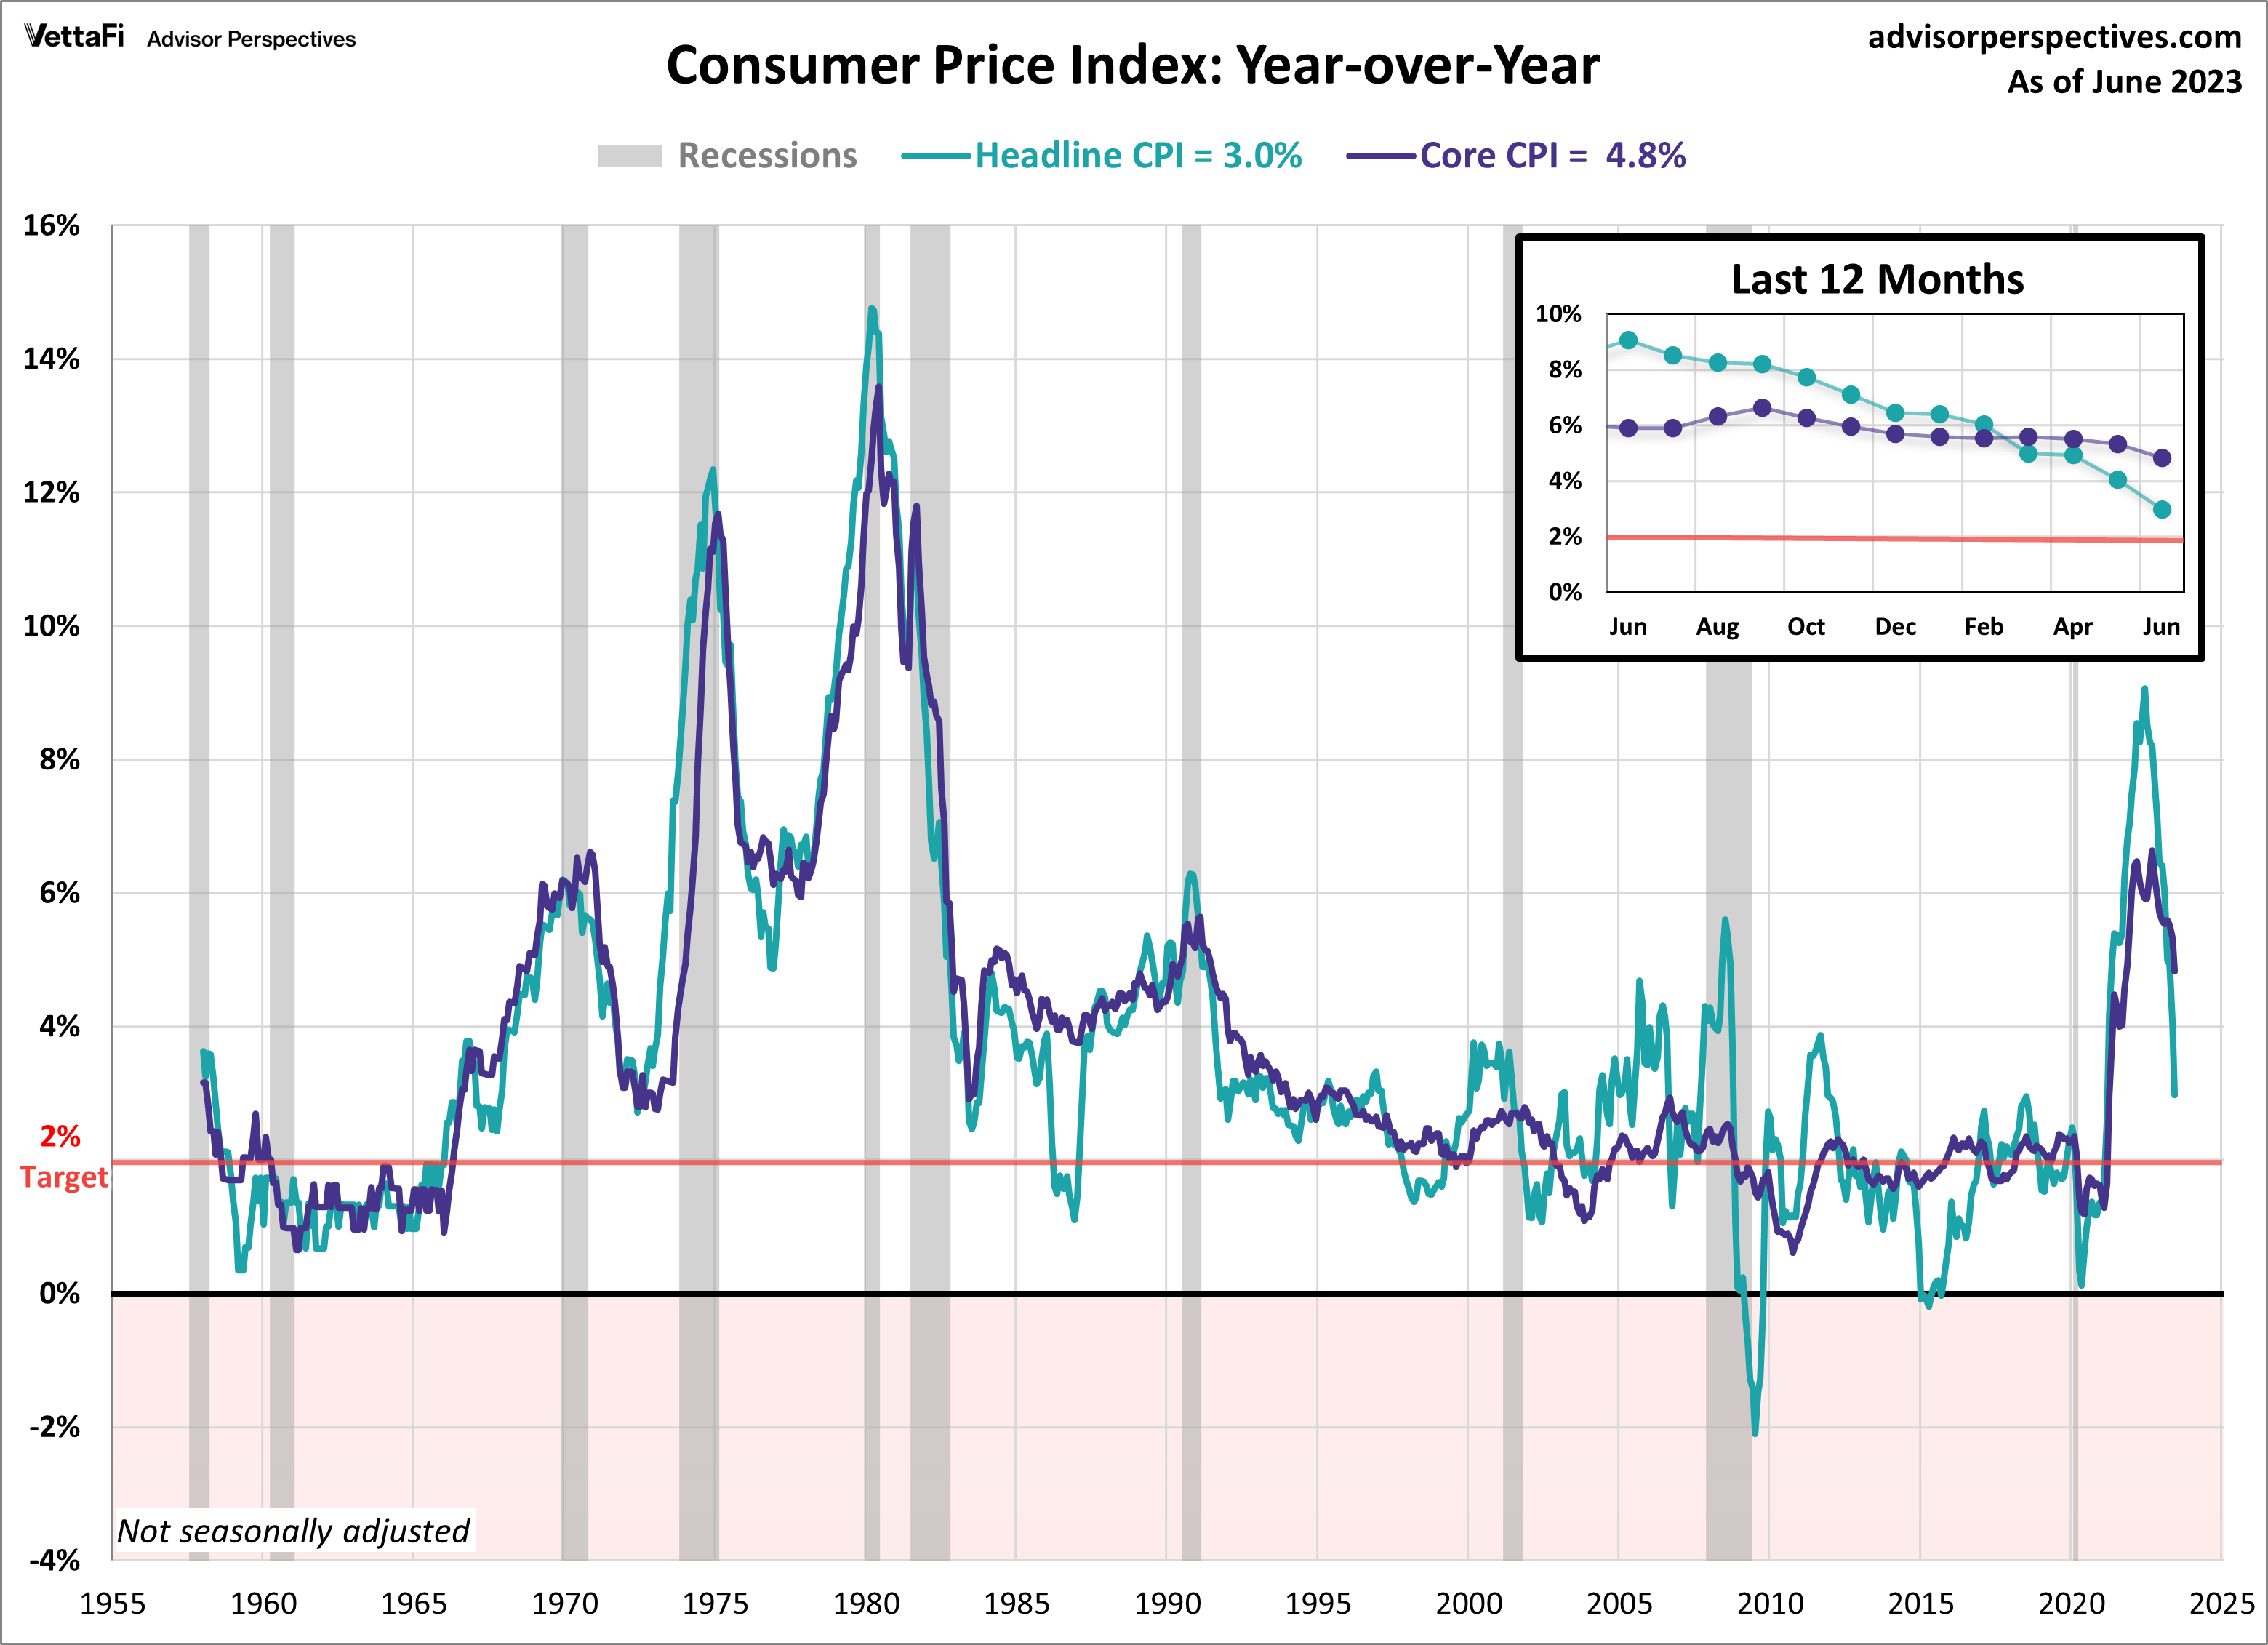
Consumer Price Index (CPI)
The tight grip of inflation is gradually weakening, as the latest CPI data reveals a significant drop to one-third of its peak reached in June 2022. The consumer price index (CPI) rose 3.0% year-over-year and 0.2% month-over-month. The latest reading came in slightly lower than the anticipated 3.1% forecast and is down from May’s 4.0% increase. It marks the twelfth consecutive month of inflation easing and the lowest level observed in almost two and half years. While core inflation also shows signs of easing, its pace is considerably slower compared to the headline number. Core CPI (excluding food and energy) rose 0.2% from May and increased 4.8% year-over-year, down from last month’s 5.3% increase. The latest reading is the lowest level for core CPI since October 2021. Although June’s data is cooler than expected and inflation continues to trend downward, both headline and core CPI levels remain above the Fed’s 2% target rate. Consequently, it is highly likely that the Fed’s next meeting will conclude with another rate hike.
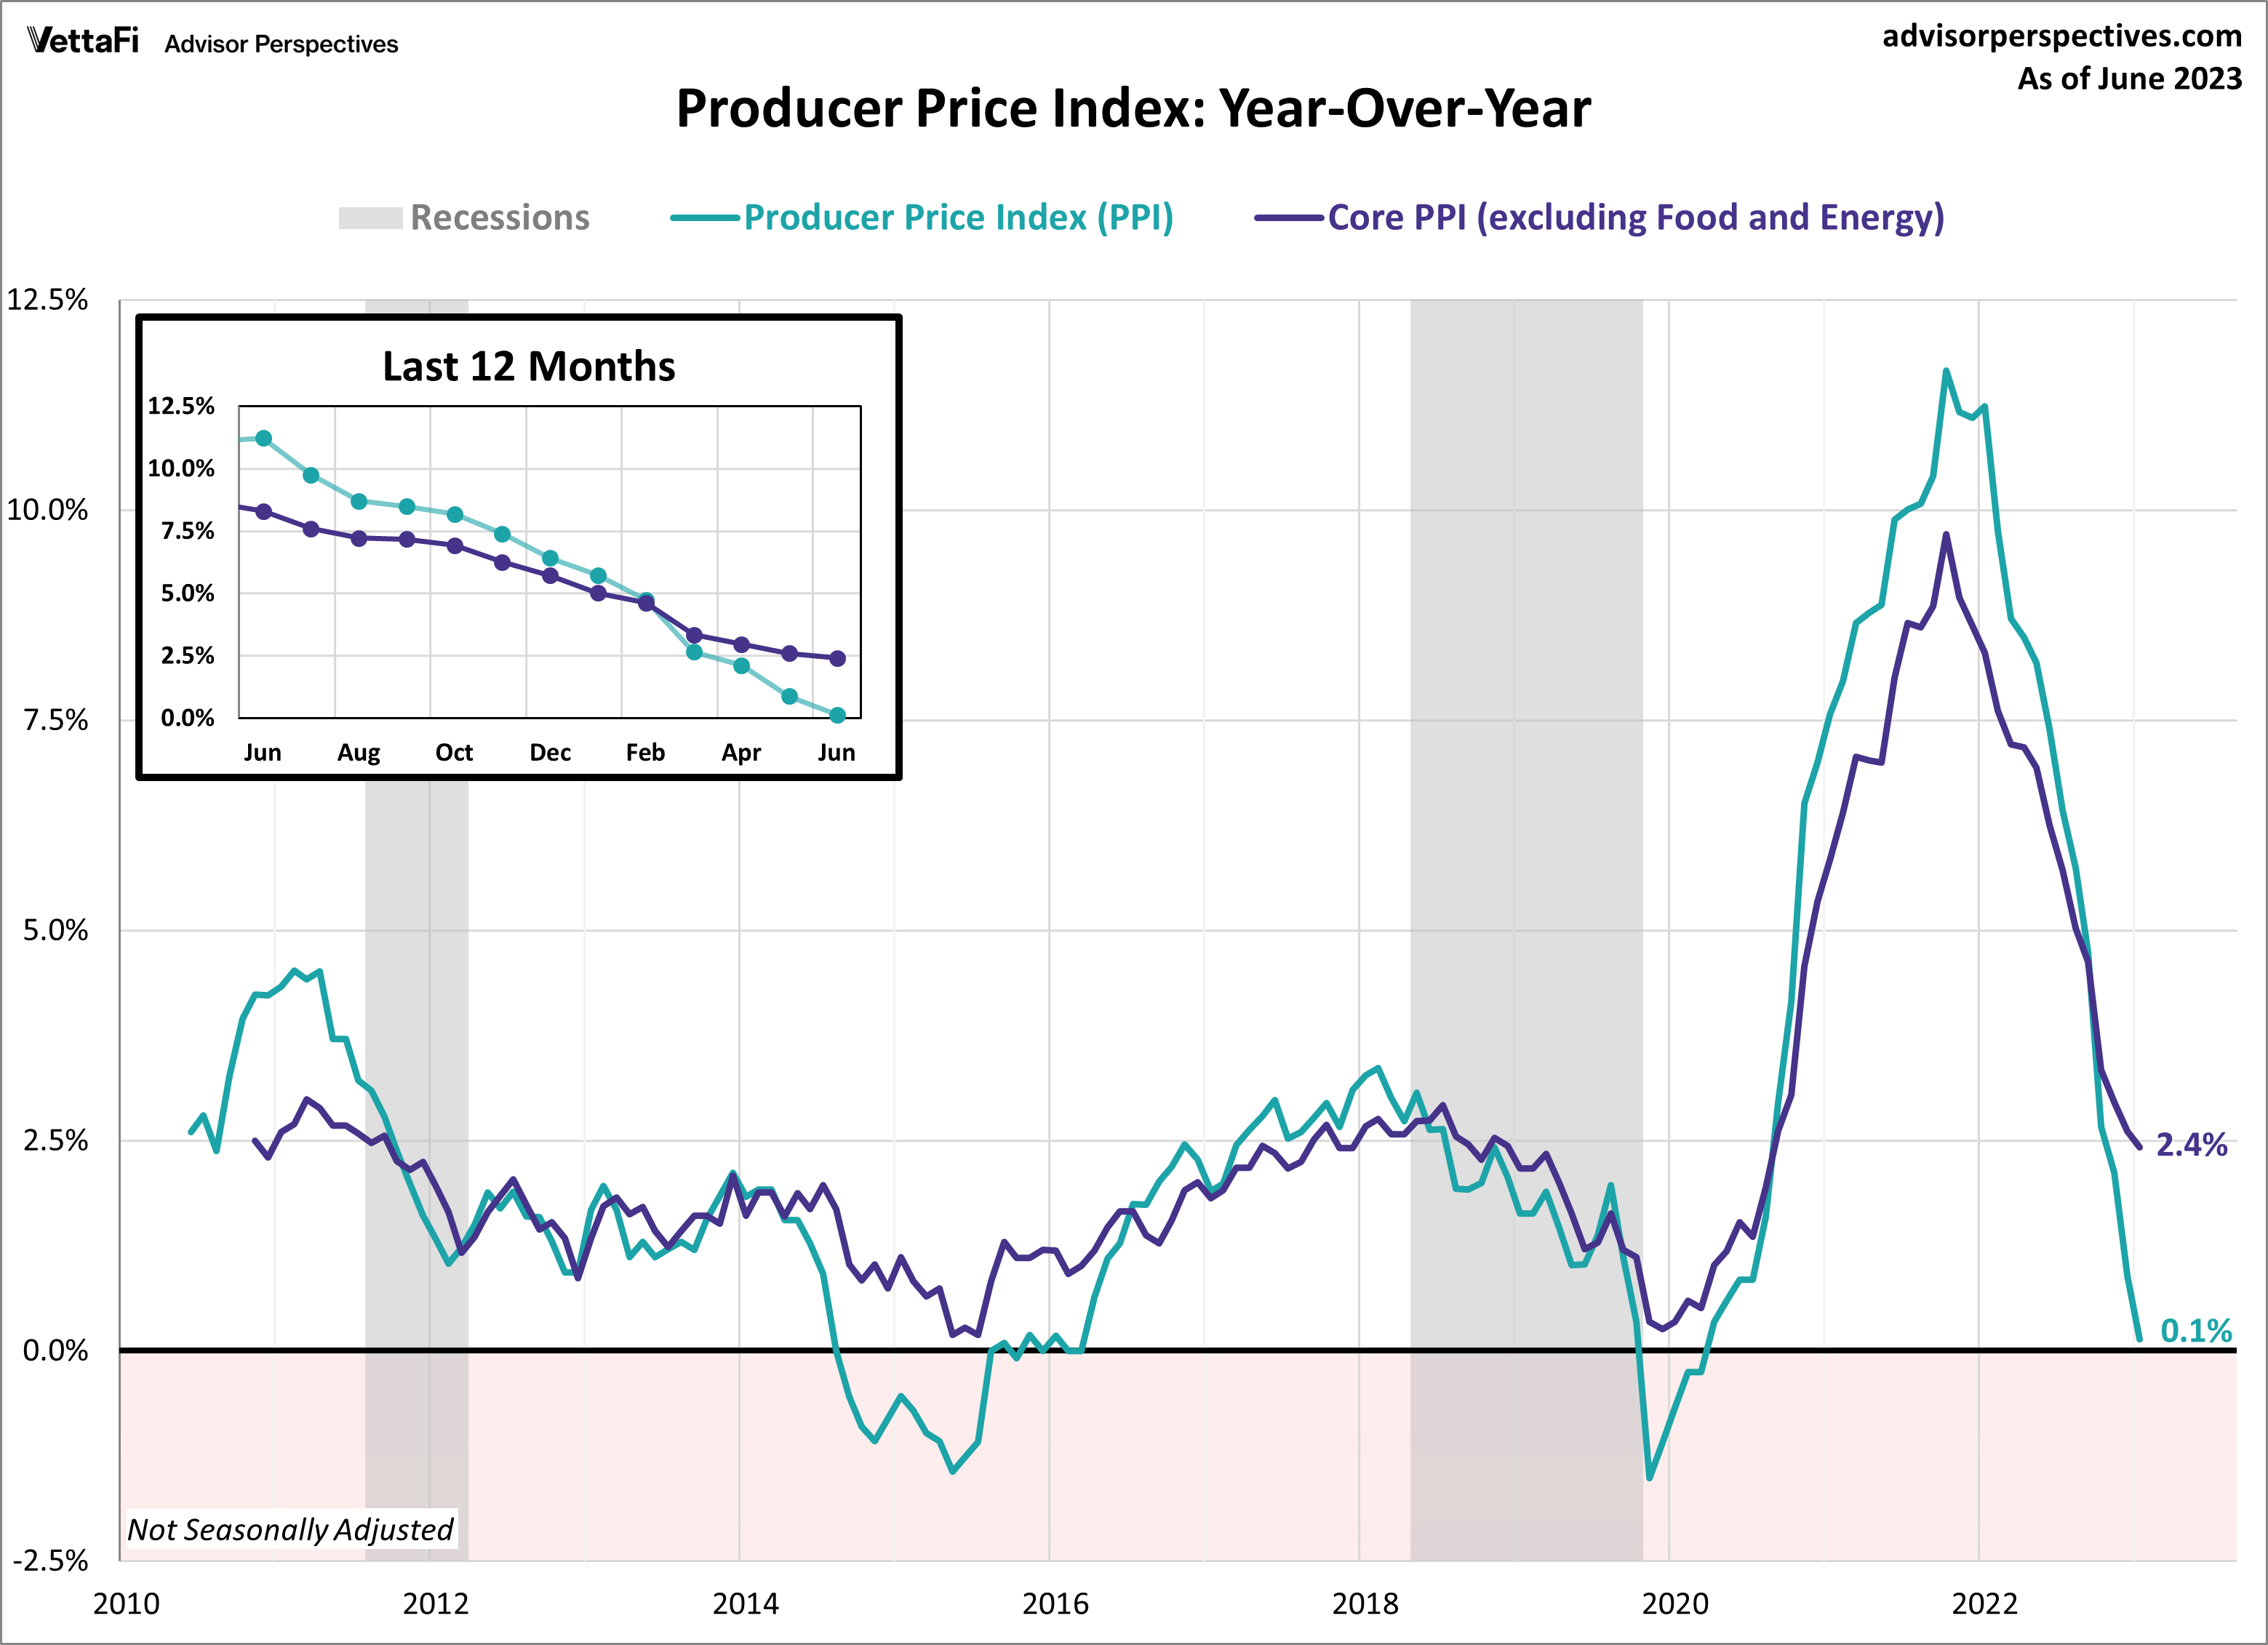
Producer Price Index (PPI)
The producer price index (PPI) for June provided additional evidence of easing inflationary pressures. Wholesale prices rose 0.1% compared to the previous year, down from last month’s 0.9% increase and below the projected 0.4% rise. This marked the 12th consecutive month of slowing for headline PPI and represents the lowest level since August 2020. On a monthly basis, headline PPI showed a 0.1% increase in wholesale prices, falling short of the expected 0.2% monthly rise. Core PPI (excluding food and energy) also came in lower than expected, showing a 2.4% annual increase, down from last month’s 2.6% increase. This marked the 15th consecutive month of slowing for core PPI, reaching its lowest level since January 2021. Additionally, core wholesale prices saw a 0.1% increase from May.
The producer price index is thought to be a leading indicator of consumer inflation since producers pass along their price shifts to the consumer level. The PPI reached its peak in March 2022 and a few months later in June the CPI reached its peak. Since then, both indexes have been cooling. The latest PPI numbers show that wholesale inflation continues to cool, offering further hope that consumer inflation will continue to follow suit.
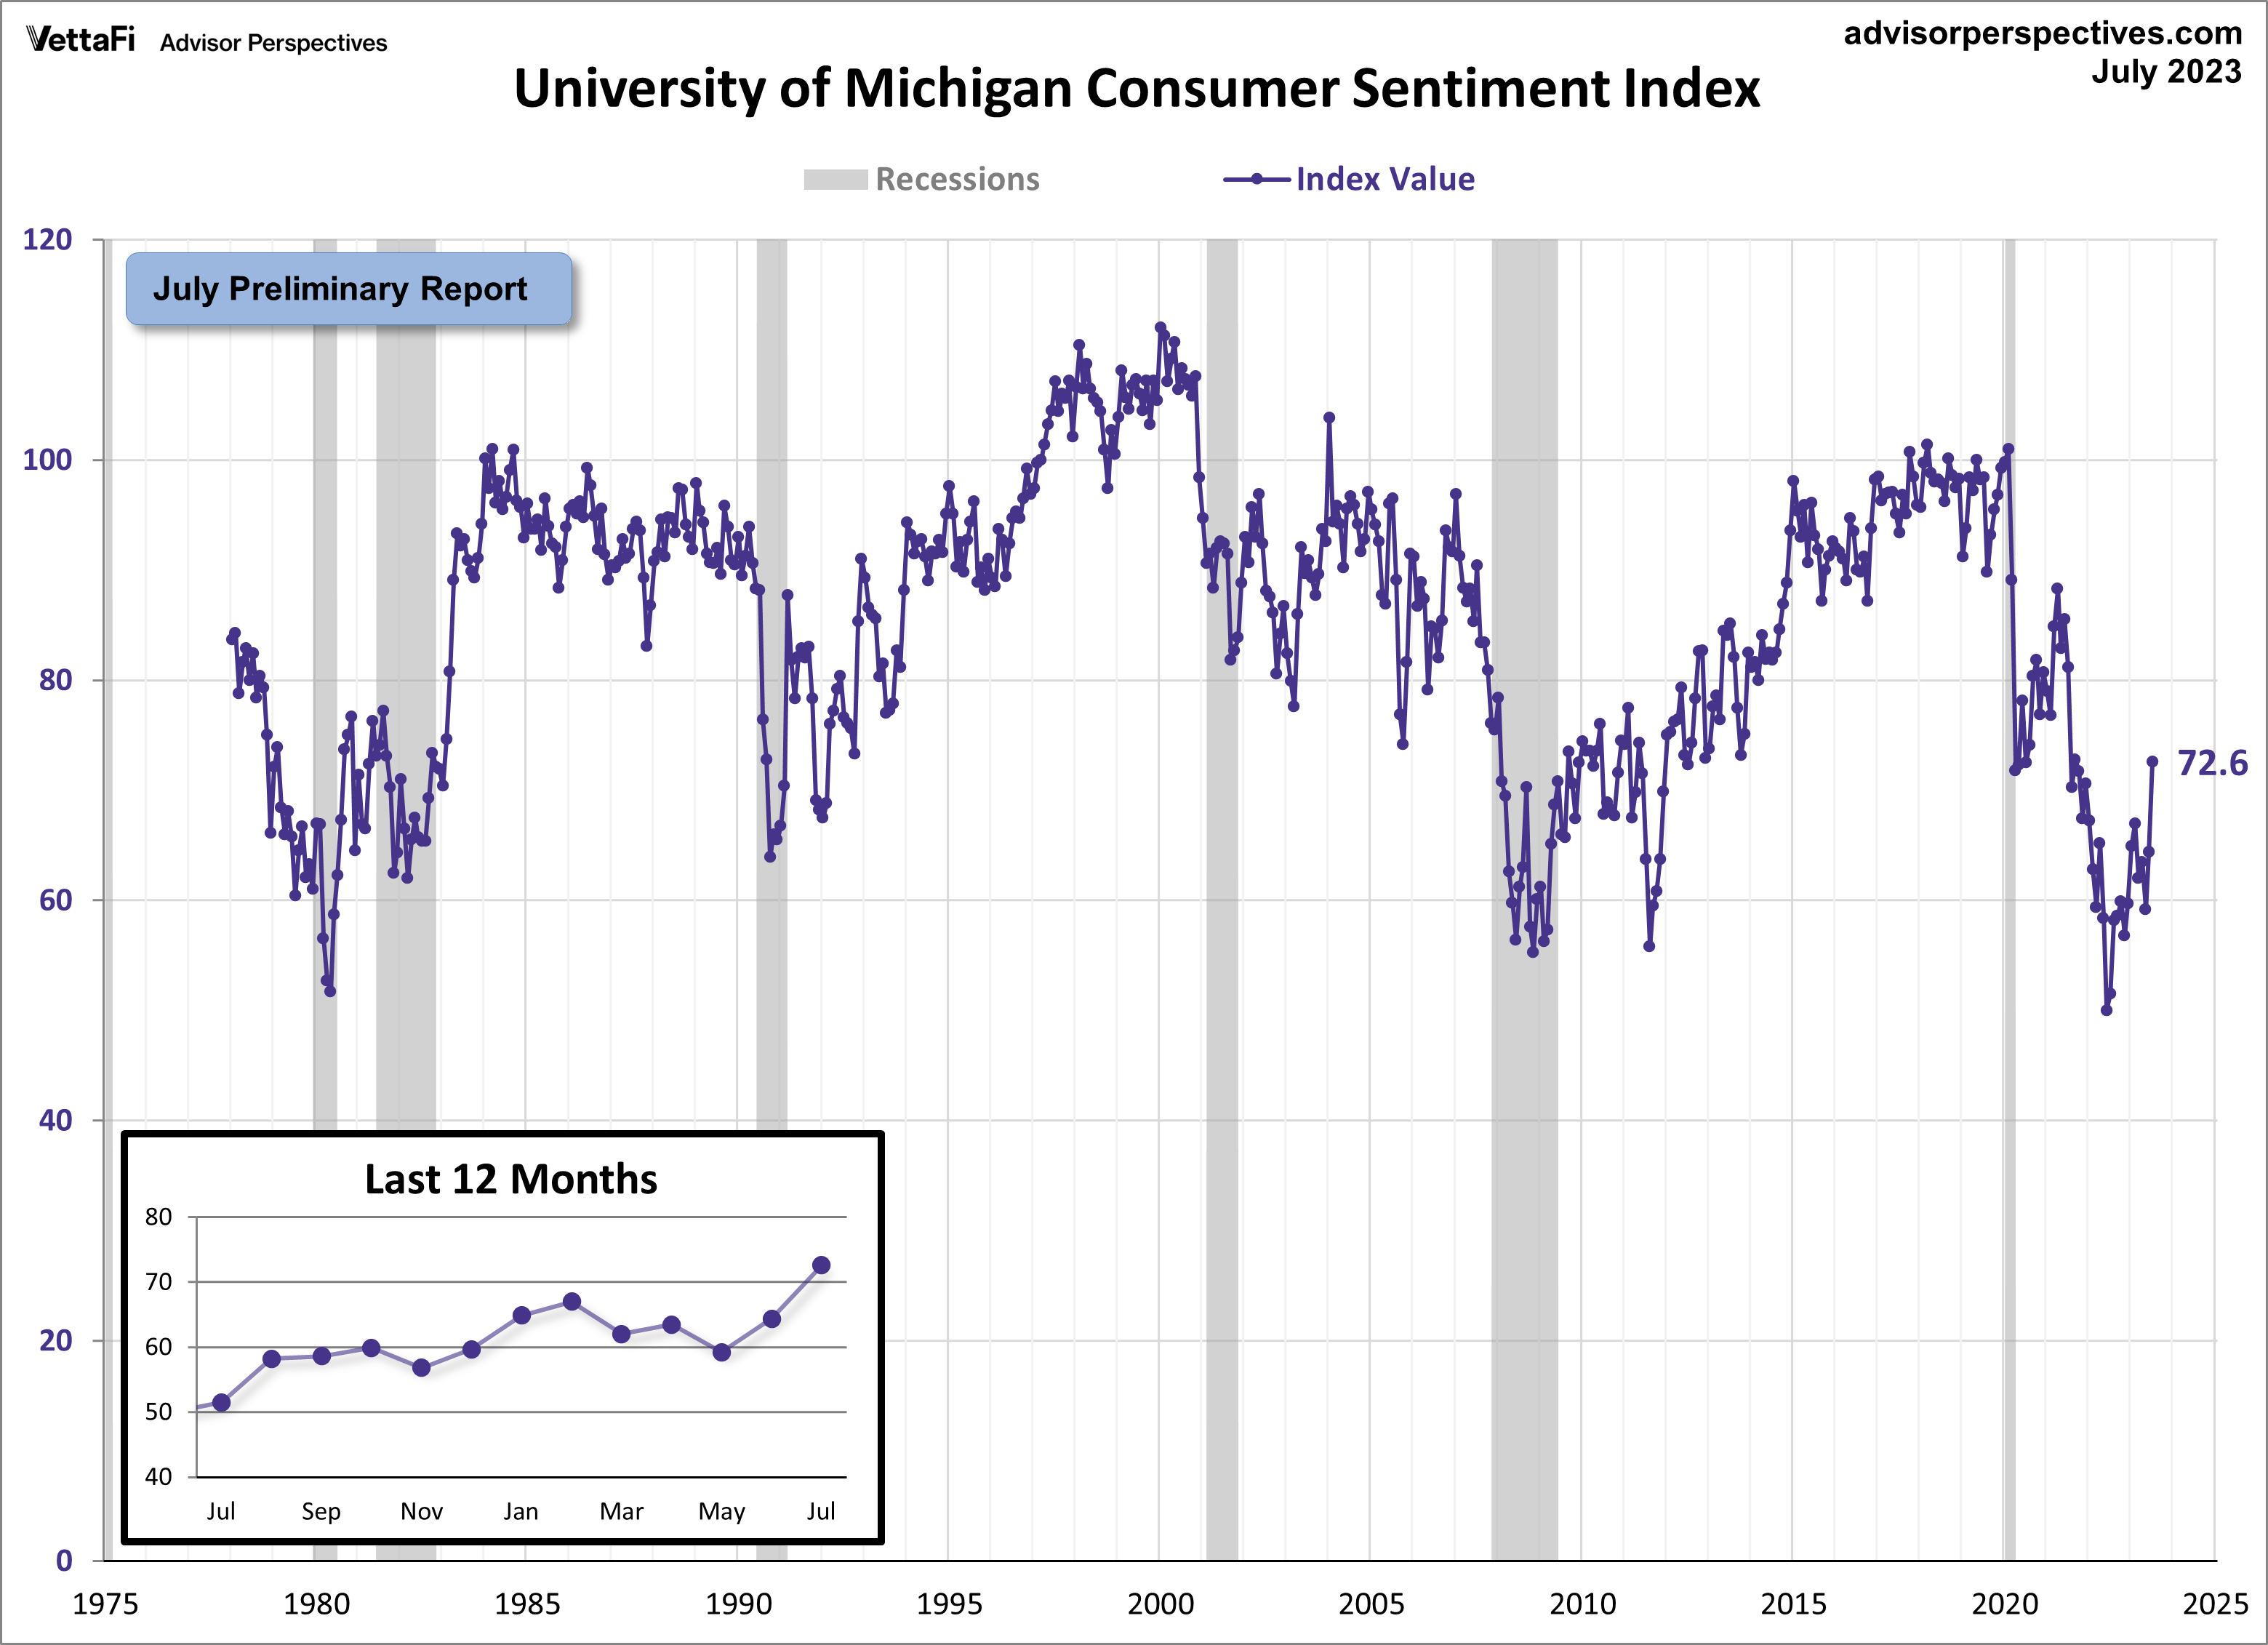
Michigan Consumer Sentiment
Consumer sentiment continued to show signs of improvement as the Michigan Consumer Sentiment Index soared to its highest level in almost two years. According to the July preliminary report, the index recorded a reading of 72.6, marking a 12.7% increase from June’s final reading and exceeding the expectations of a 65.5 reading. This is the largest monthly increase the index has seen in almost a year and puts the index almost halfway between the all-time low reached in June 2022 and the February 2020 pre-pandemic reading.
The index is a monthly survey measuring consumers’ opinions with regards to the economy, personal finances, business conditions, and buying conditions. In the latest report, all components of the index showed improvement, however the recent upturn in consumer sentiment can largely be attributed to easing inflation and stability in labor markets. Since consumer spending accounts for approximately 70% of the economy, consumer attitudes are closely monitored, as their confidence levels directly impact their spending behavior and, consequently, economic growth. The Consumer Discretionary Select Sector SPDR ETF (XLY) is tied to consumer sentiment.
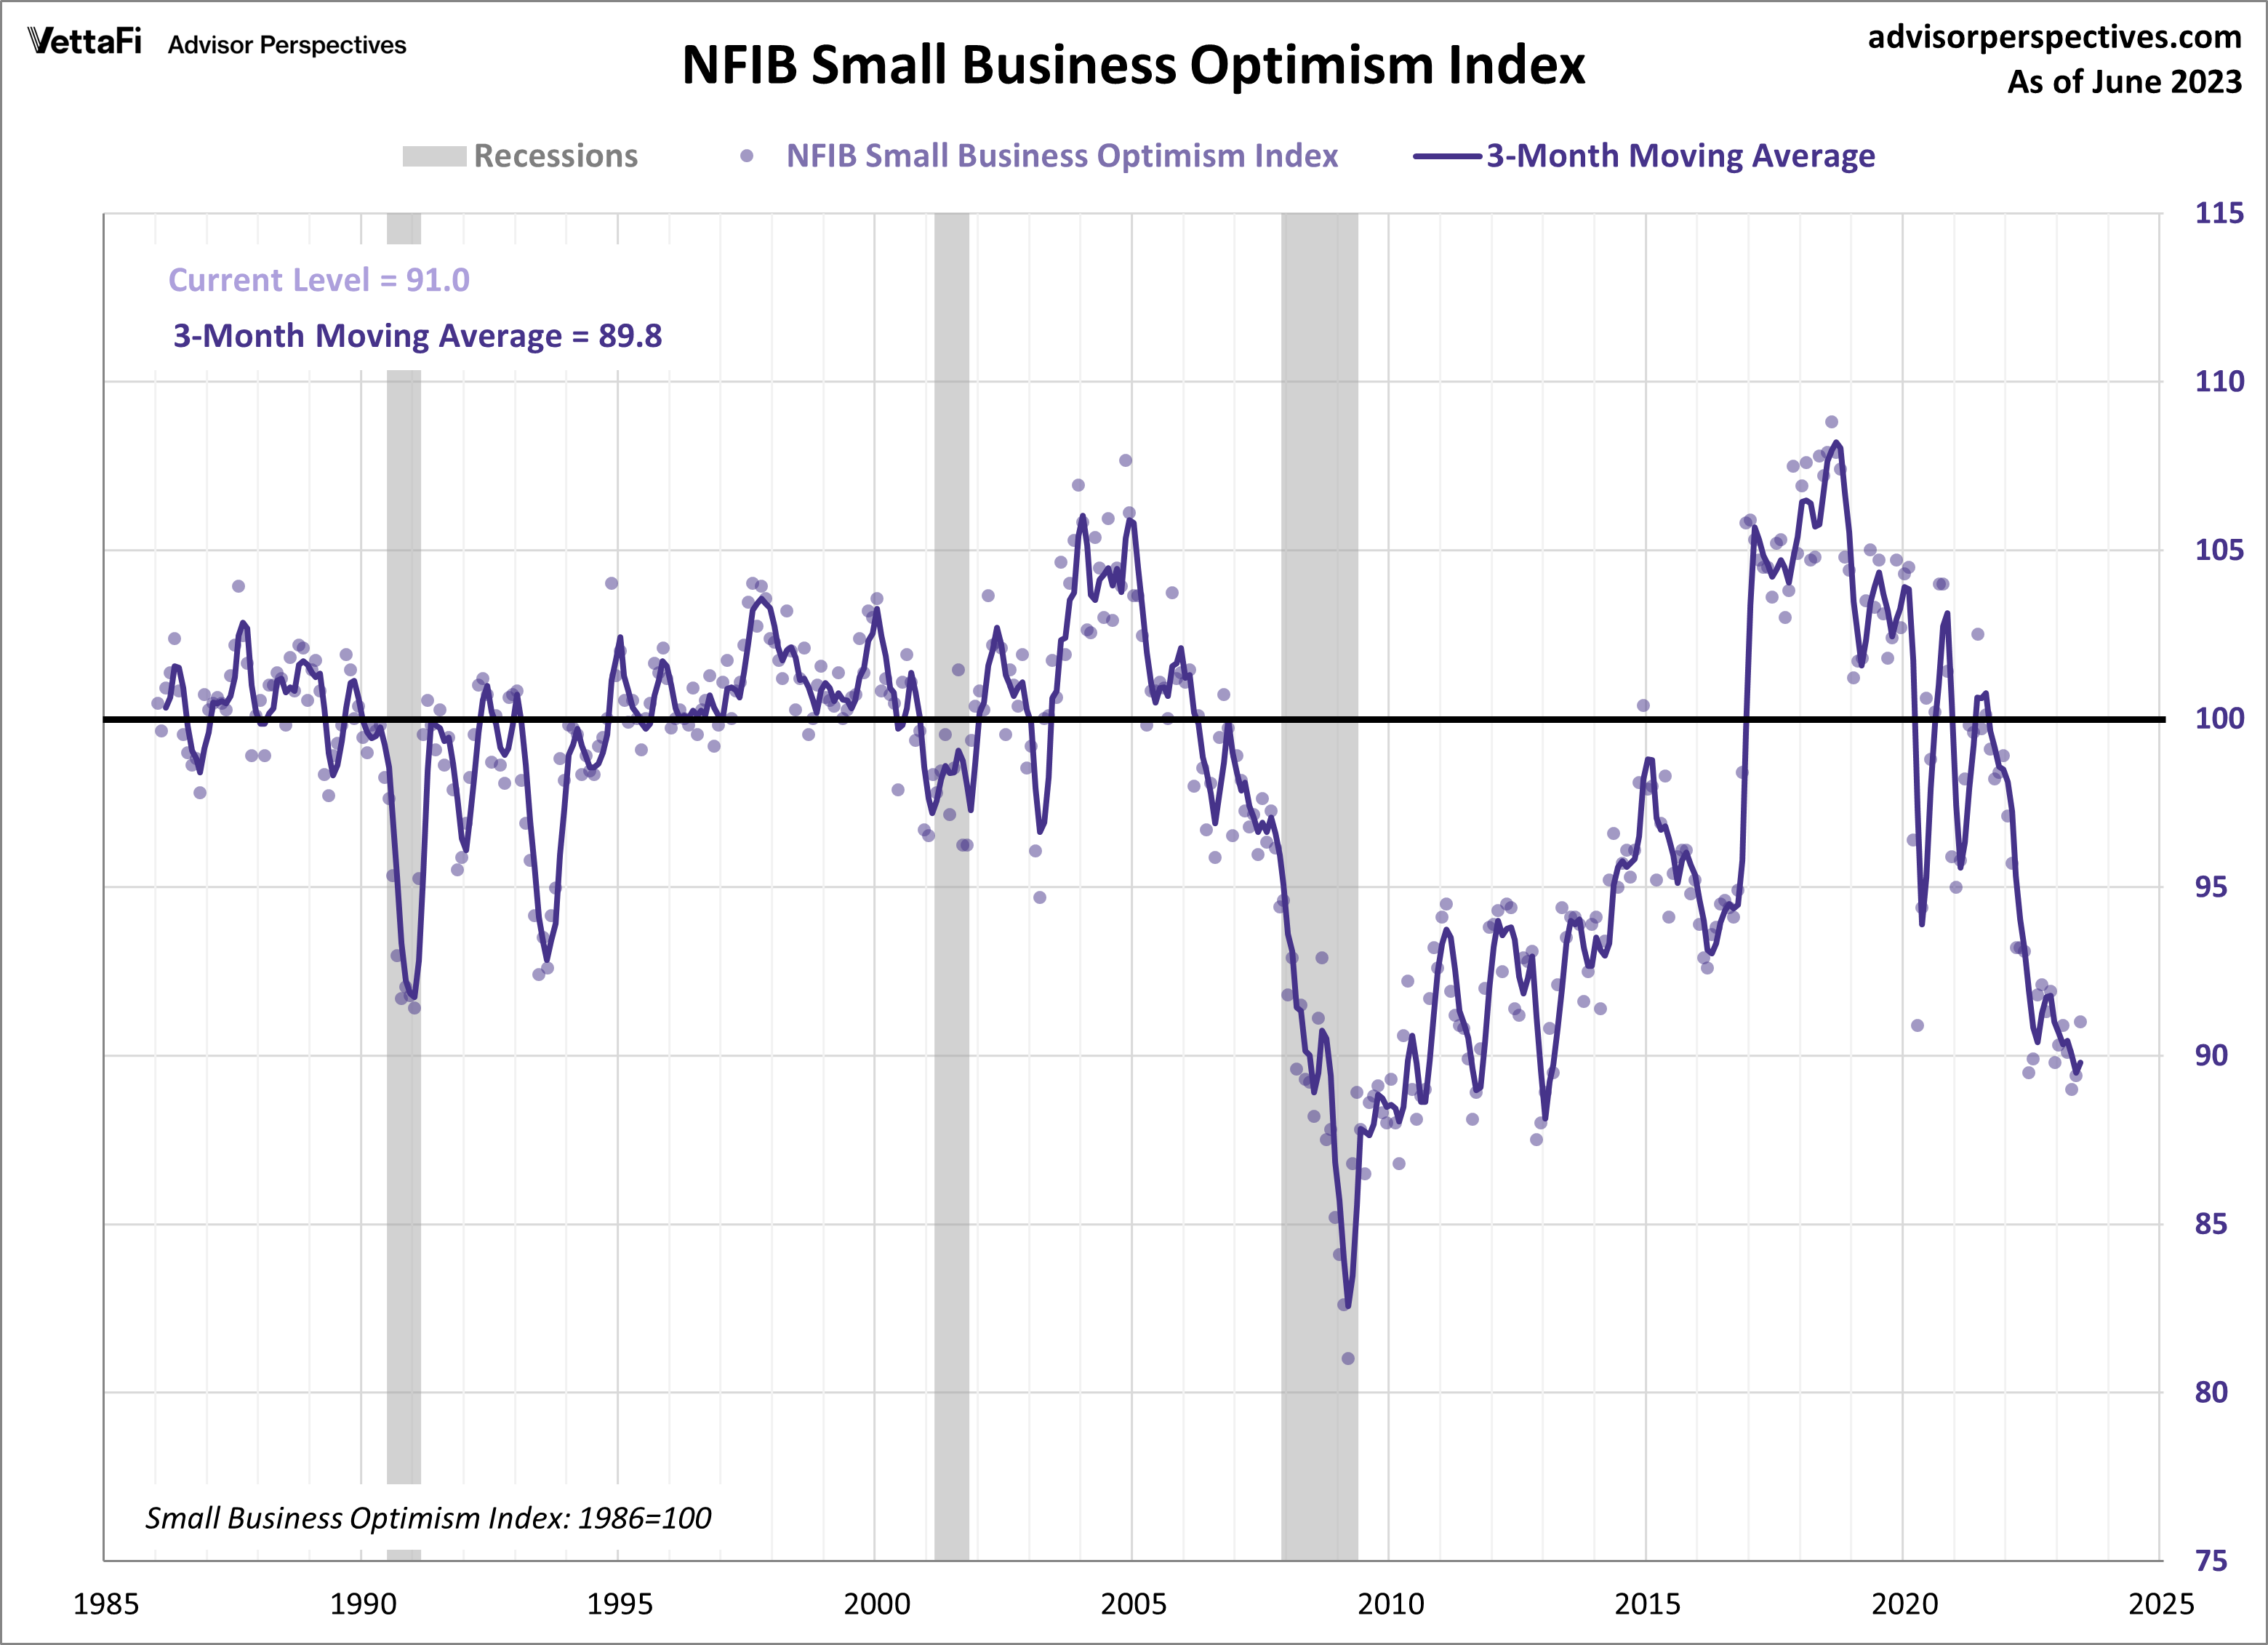
NFIB Small Business Optimism Index
Optimism among small business owners improved for a second straight month to its highest level since November 2022. The NFIB Small Business Optimism Index experienced a notable increase of 1.6 points in June to 91.0, marking its largest monthly upswing in almost a year. Despite this positive shift, business owners are still pessimistic about future business conditions and their sales prospects. The latest reading marks the 18th consecutive month the index has been below the series average of 98.1, positioning it at the 10th percentile of the series. This index offers a composite view that aims to provide an indication of the overall health of small businesses in the country. In the latest report, the top concerns plaguing small business owners are inflation and labor shortages. Given that small businesses account for approximately 50% of the U.S. workforce, the well-being of the small business sector can significantly impact the wellbeing of the overall economy.
Economic Indicators and the Week Ahead
Next week, all eyes will be on the housing market as we eagerly await the release of key data for June. Over the course of the week, we will receive the latest news on builder confidence in home sales, building permits, housing starts, and existing home sales. These housing market indicators will have an impact on homebuilders and residential real-estate ETFs such as iShares U.S. Home Construction ETF (ITB), SPDR S&P Homebuilders ETF (XHB), and iShares Residential and Multisector Real Estate ETF (REZ).
The National Association of Home Builders housing market index, which measures builder confidence in home sales, is expected to remain at 55, the index’s highest level since July 2022. Building permits are forecasted to be practically unchanged from last month while housing starts are expected to fall significantly to a seasonally adjusted annual rate of 1.450 million. Finally, existing home sales are projected to continue their downward trend by dropping to a seasonally adjusted annual rate of 4.23 million units, marking the 15th monthly decline over the last 17 months.
For more news, information, and analysis, visit the Portfolio Strategies Channel.
