
Economic indicators are released every week to help provide insight into the overall health of the U.S. economy. In this article, we examine three important indicators from the past week: consumer price index, producer price index, and retail sales. By examining these data points, we gain valuable information about inflation in the U.S., as well as consumer spending patterns and their response to the ongoing inflation battle.
Policymakers and advisors closely monitor economic indicators, such as these three, to understand the direction of interest rates, as the data can ultimately impact business decisions and financial markets. In the week ending on June 15, the SPDR S&P 500 ETF Trust (SPY) rose 3.14% while the Invesco S&P 500® Equal Weight ETF (RSP) was up 2.49 %. During its meeting last week, the Fed paused rate hikes but signaled that future hikes remain a very real possibility.
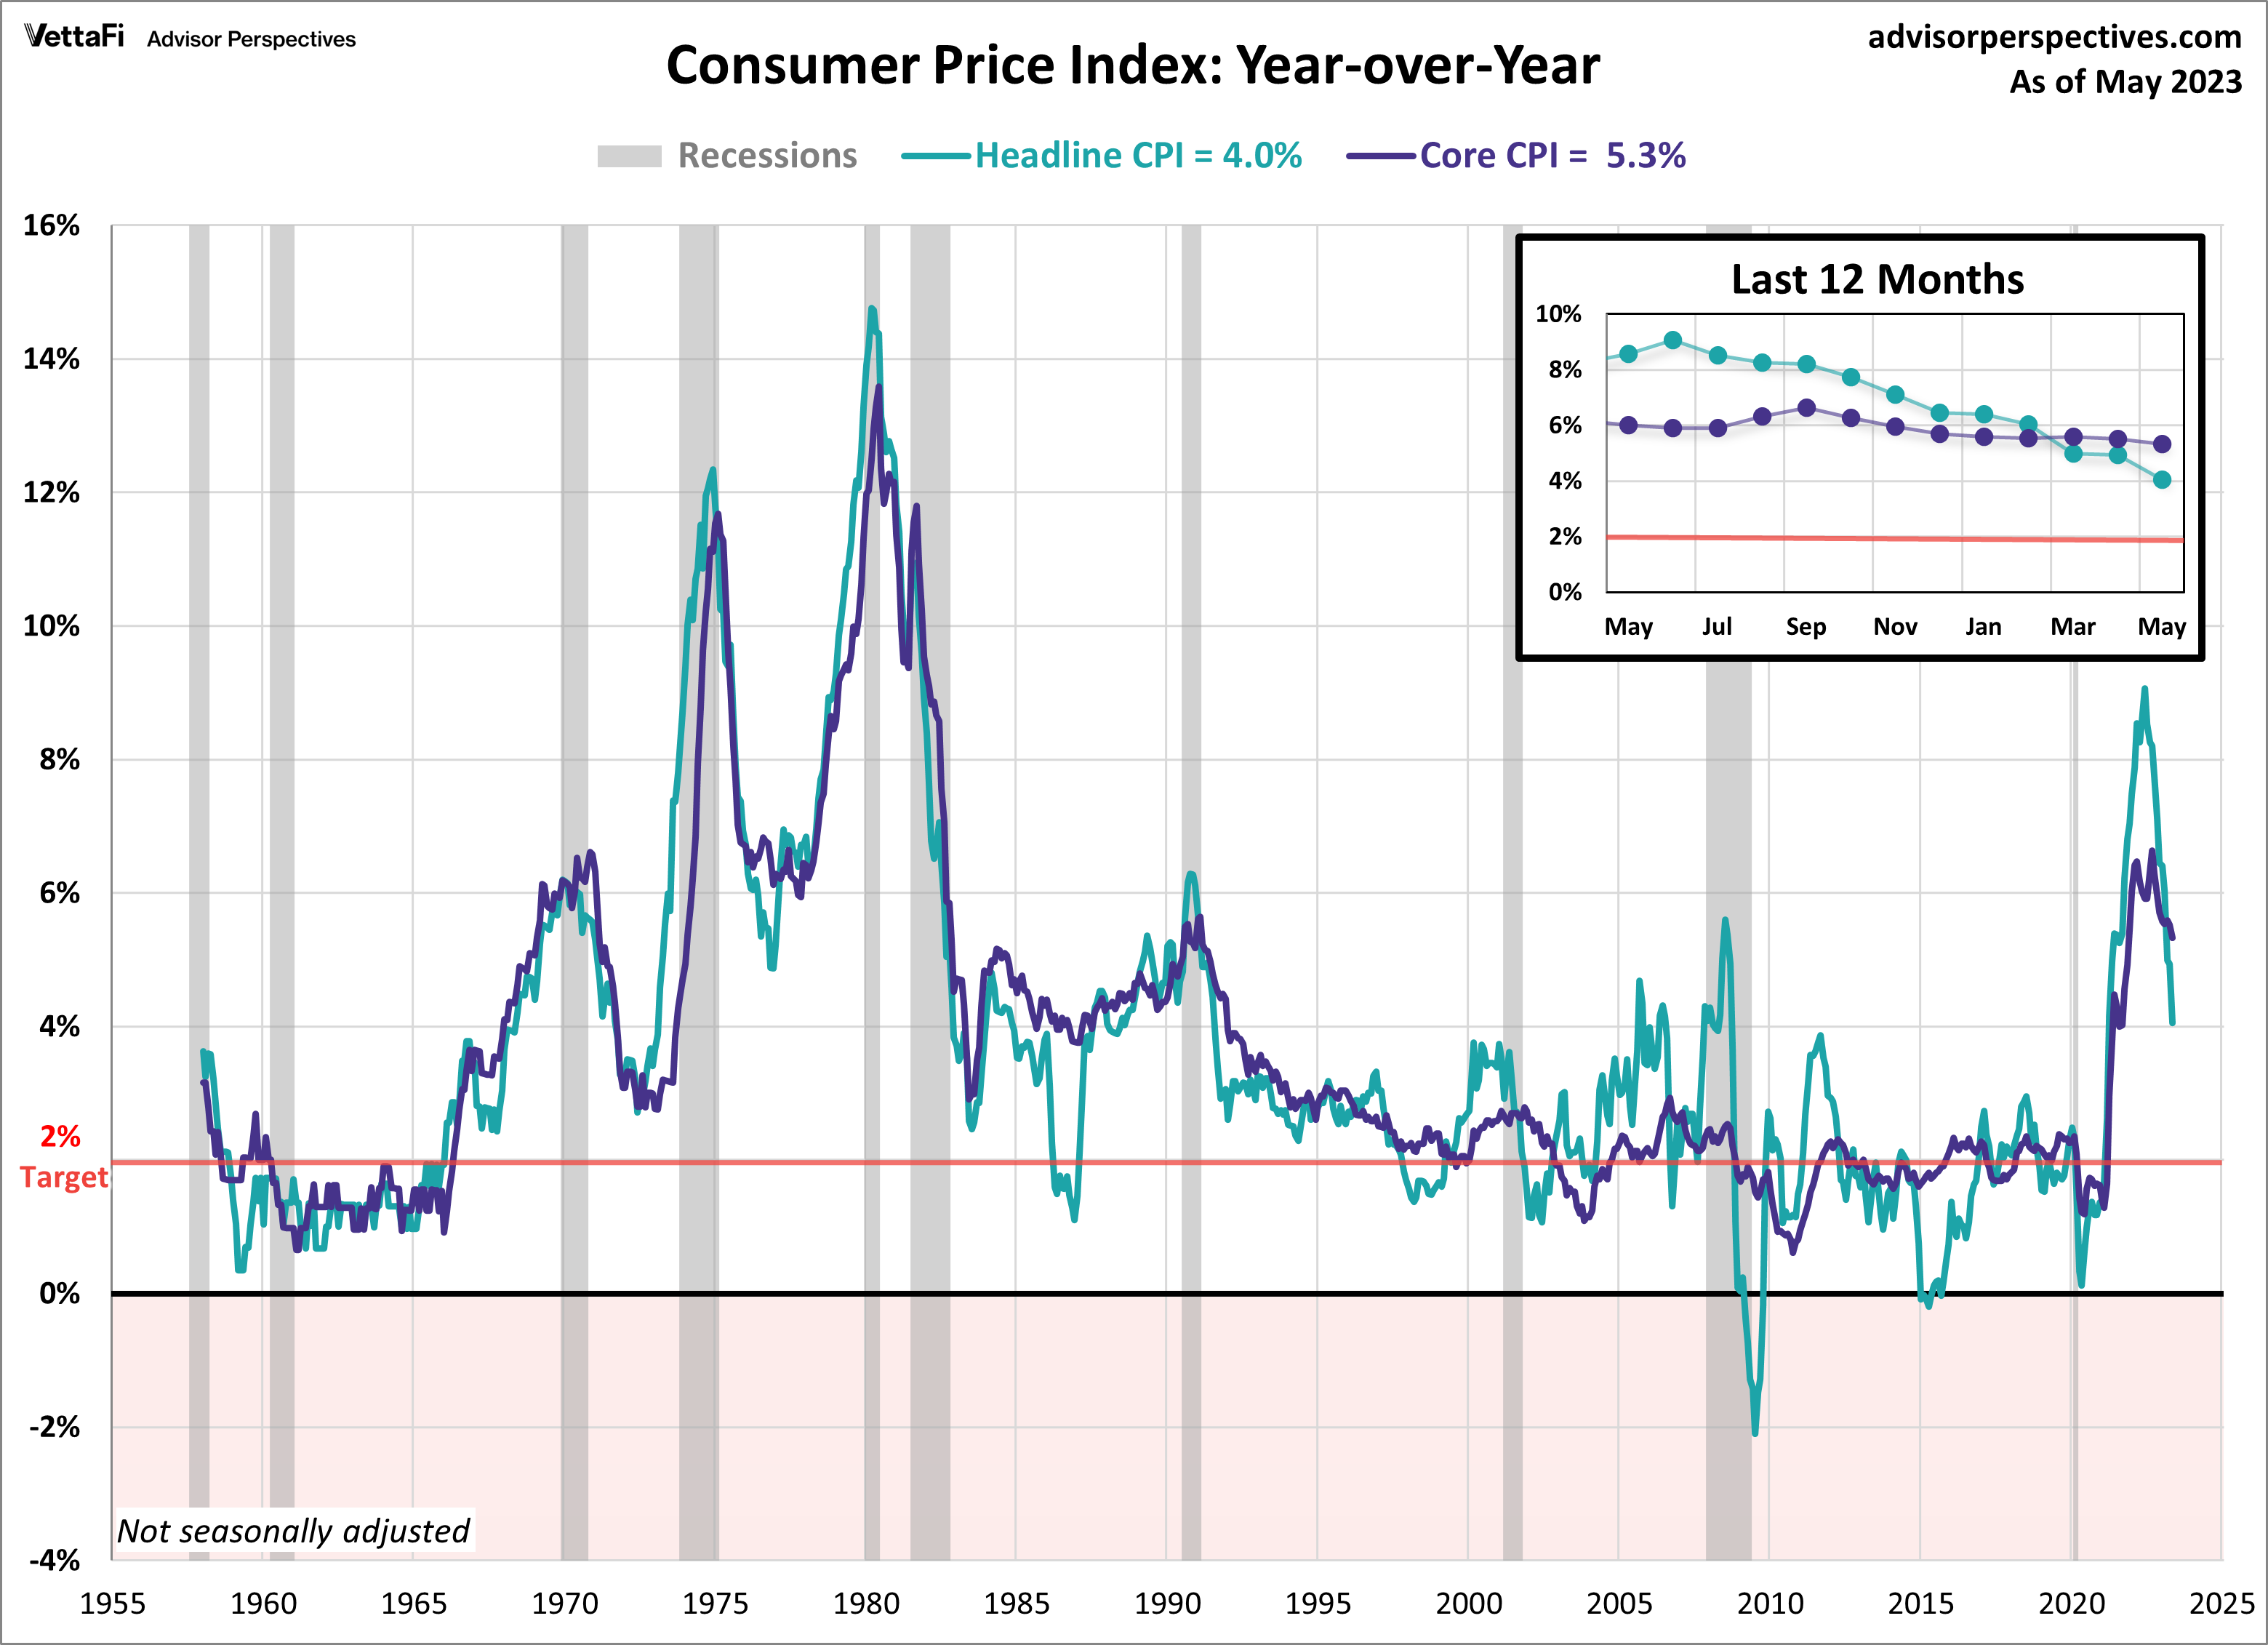
Consumer Price Index (CPI)
The relentless grip of inflation continues to loosen its hold, as the latest CPI data continues to move away from the extreme levels that have characterized the last few years. The consumer price index (CPI) rose 4.0% year-over-year and 0.1% month-over-month. The latest reading came in slightly lower than the expected 4.1% forecast and is down from April’s 4.9% increase. This marks the eleventh consecutive month that inflation has eased and is the lowest level in over two years.
Core inflation also showed signs of easing; however, the cooldown has been much slower than the headline number. Core CPI (excluding food and energy) rose 0.4% from April and increased 5.3% year-over-year, down from last month’s 5.5% increase. Both the annual and monthly increases met expectations. The latest reading is the lowest level for core CPI since November 2021. Although May’s data played a vital role in the Fed’s decision to pause rate hikes, headline and core CPI levels remain well above the Fed’s 2% target rate, so the possibility of future hikes remains on the horizon.
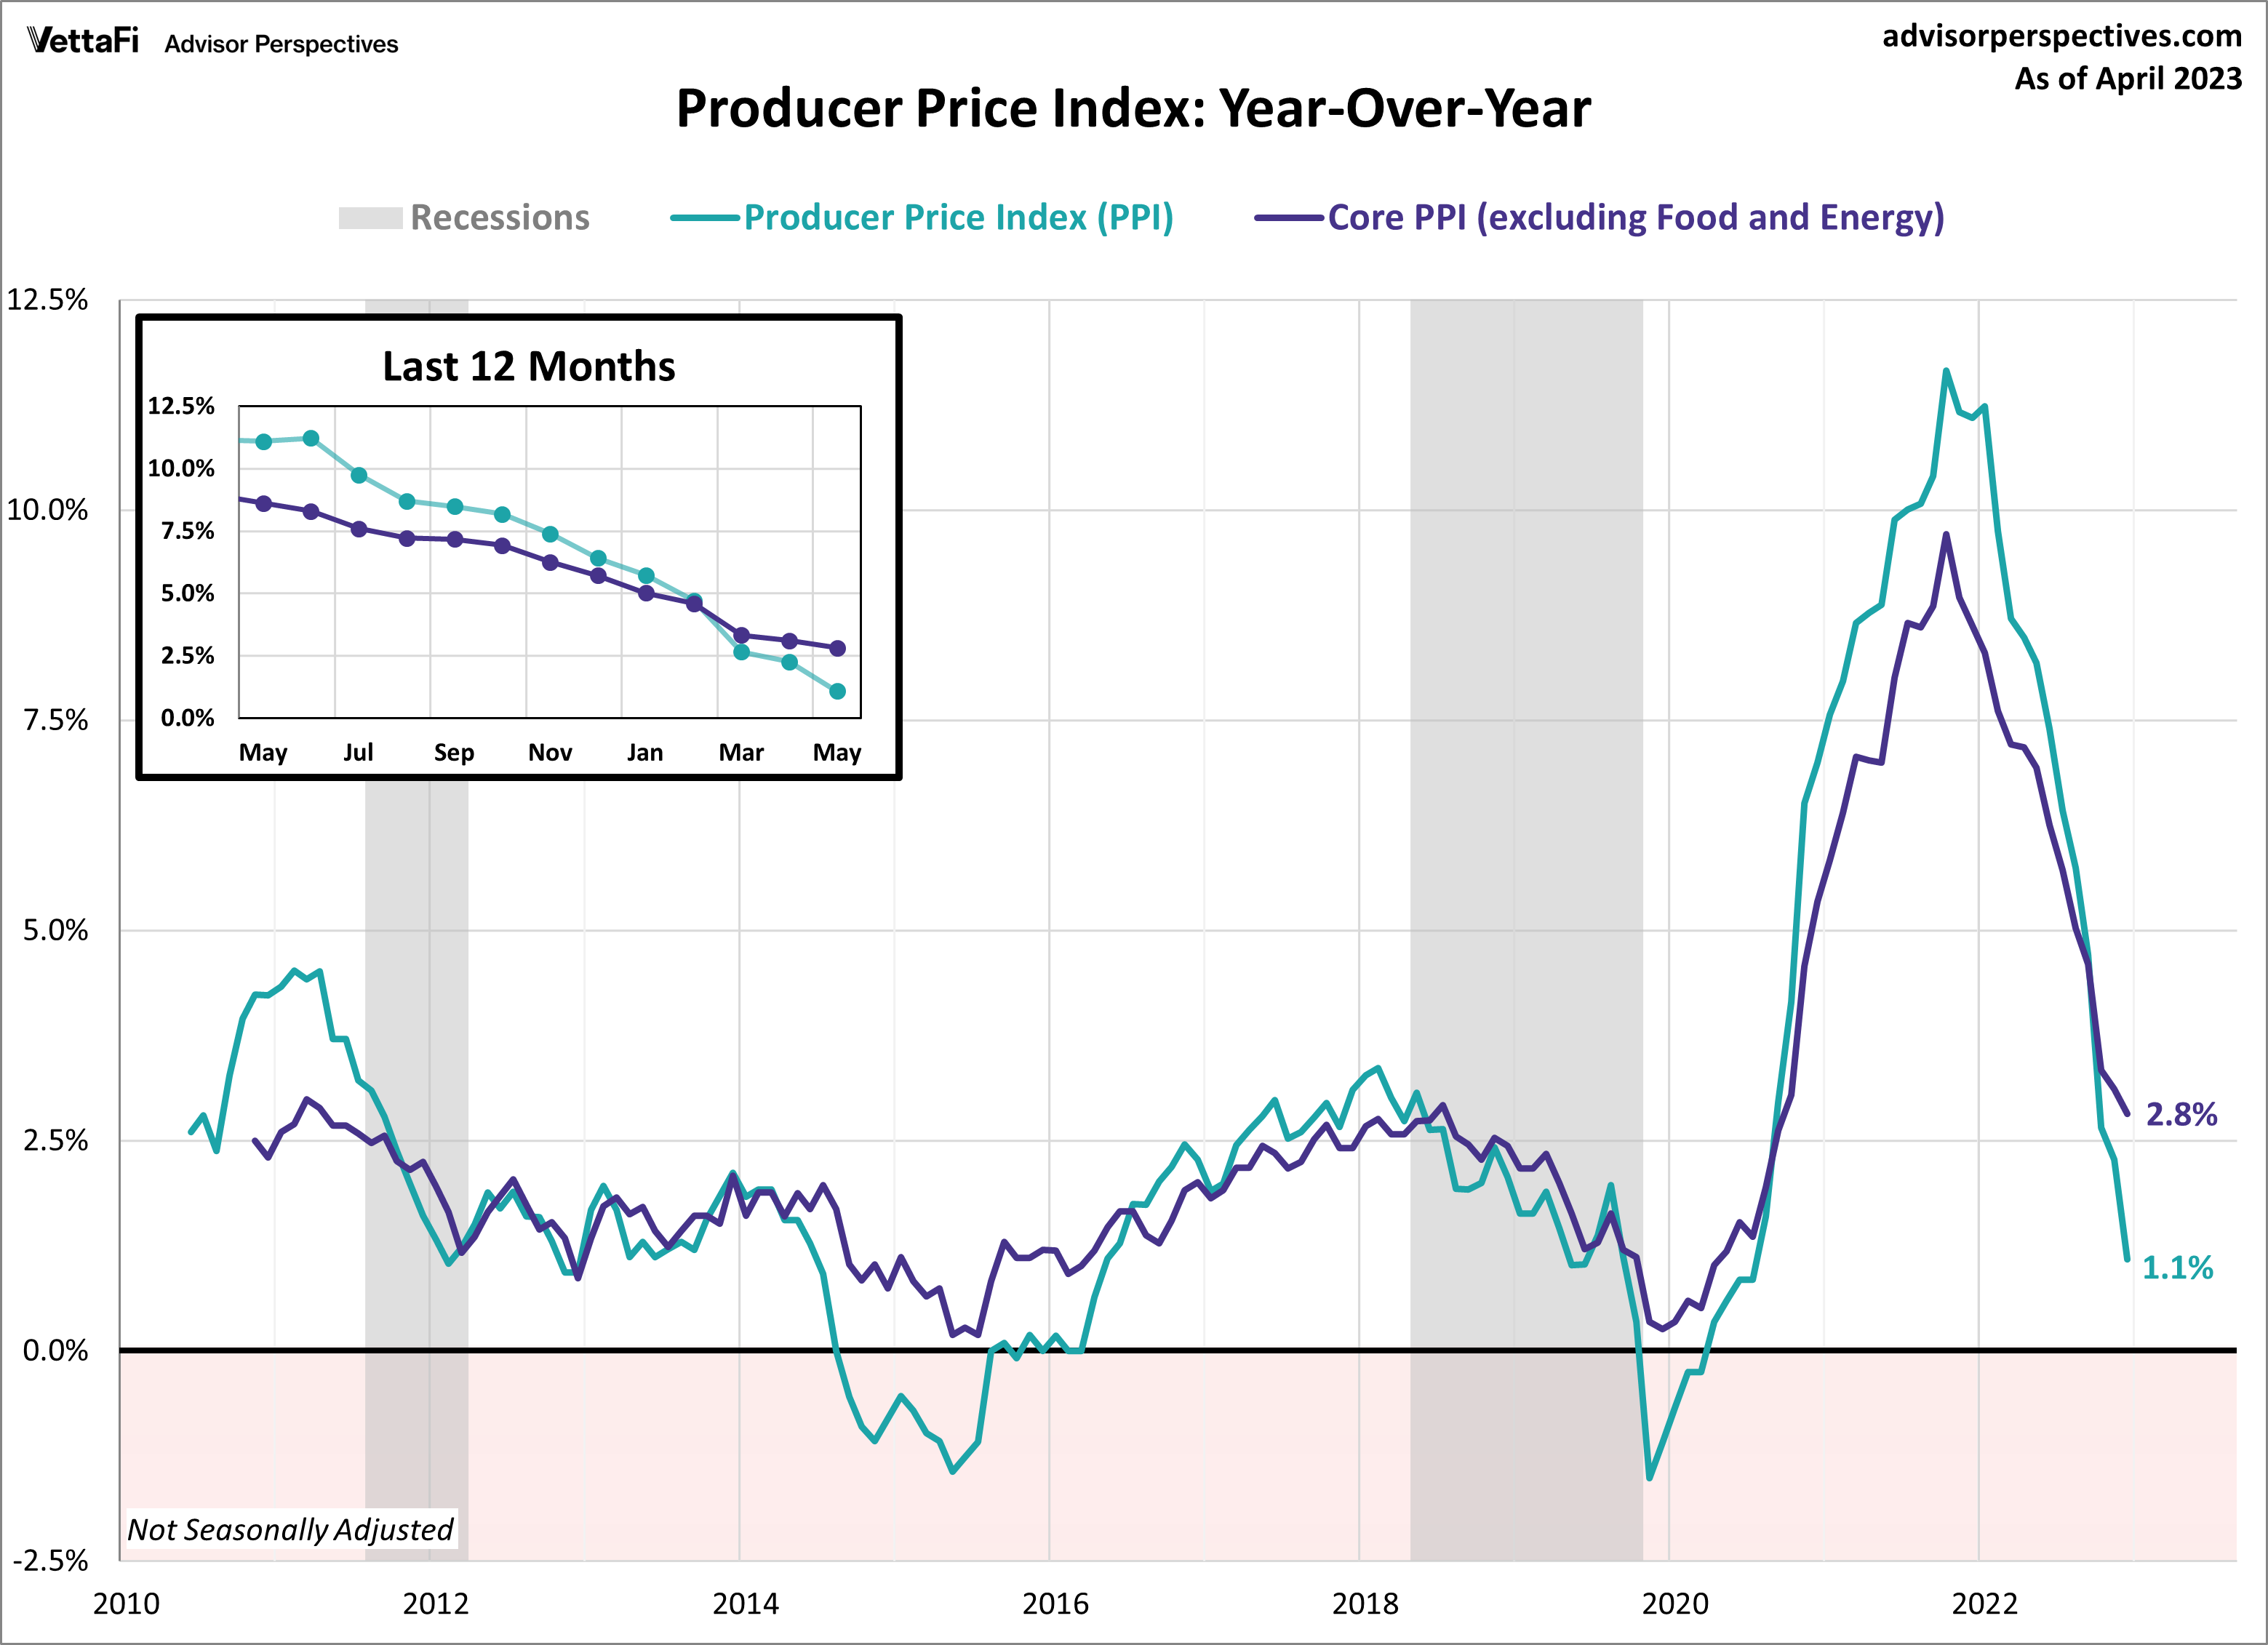
Producer Price Index (PPI)
The producer price index (PPI) for May offered further evidence that inflationary pressures are subsiding. Headline PPI showed a 0.3% decrease in wholesale prices from April. This was larger than the expected 0.1% monthly decline in prices. On an annual basis, wholesale prices rose 1.1%, which was down from last month’s 2.3% increase. This marked the 11th consecutive month that headline PPI has slowed.
Core PPI (excluding food and energy) came in as expected, showing a 0.2% increase in wholesale prices from April. Additionally, core prices increased 2.8% compared to one year ago, down from last month’s 3.1% annual increase. This is the 14th consecutive month that core PPI has slowed. Headline and core PPI are currently at their lowest levels in over two years. The producer price index is considered a leading indicator of consumer inflation, since producers pass along their price shifts to the consumer level. The latest PPI numbers show that wholesale inflation continues to cool, providing hope that consumer inflation will follow suit.
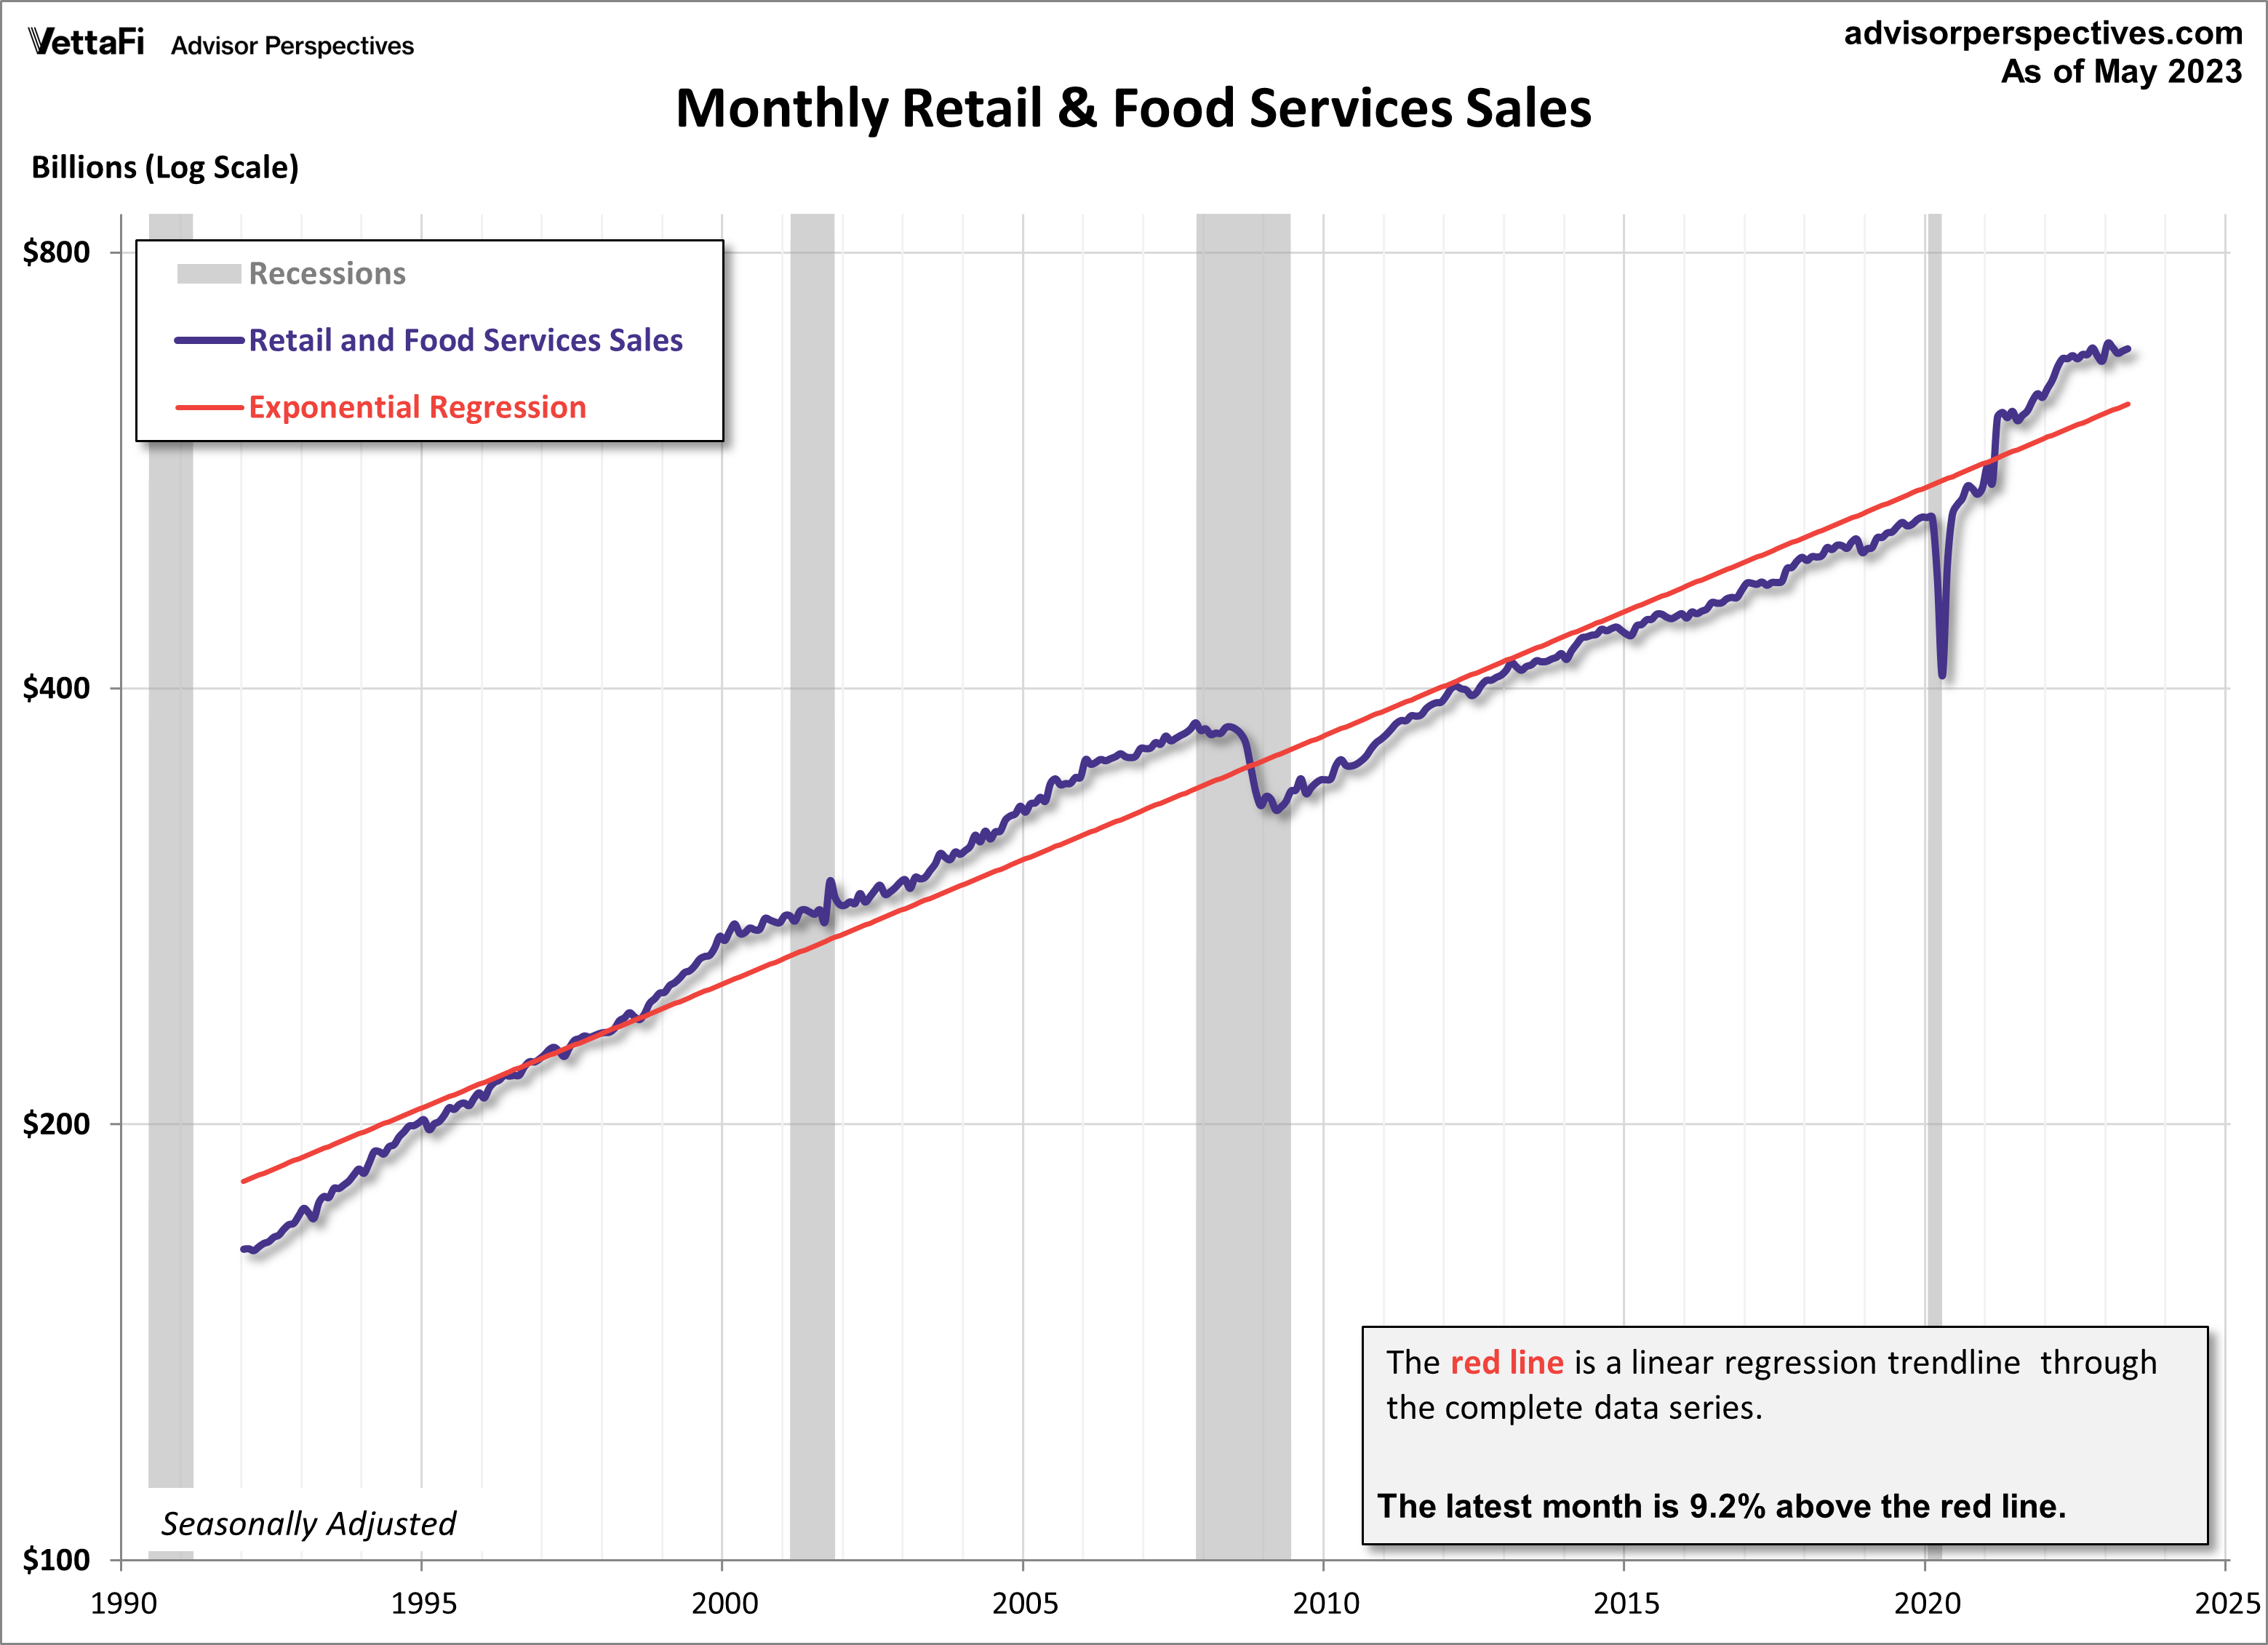
Retail Sales
American consumers continued to fuel the economy as spending rose for a second consecutive month. Retail sales unexpectedly rose 0.3% in May from last month, despite expectations that purchases were going to drop 0.1%. Consumer spending has risen in three of the five months this year. That’s even with increased interest rates, tightening credit conditions, and high inflation. In other words, consumers remain resilient and are not ready to cut back on their purchases just yet. Core retail sales (excluding automobiles) were up 0.1% from last month. Control purchases, which considered an even more “core” view of retail sales, were up 0.2% from last month. Retail sales will have an impact on the interest in the SPDR S&P Retail ETF (XRT).
In the upcoming week, the housing market will take center stage as we anticipate the release of key data for May. Throughout the week, we will receive the latest news on builder confidence in home sales, building permits, housing starts, and existing home sales. These housing market indicators will have an impact on homebuilders and residential real estate ETFs such as the iShares U.S. Home Construction ETF (ITB), the SPDR S&P Homebuilders ETF (XHB), and the iShares Residential and Multisector Real Estate ETF (REZ).
The National Association of Home Builders housing market index, which measures builder confidence in home sales, is expected to remain at 50. That’s the index’s highest level since July 2022. Building permits are forecast to increase to a seasonally adjusted annual rate of 1.435 million following two straight monthly declines. Housing starts are expected to inch up slightly to a seasonally adjusted annual rate of 1.405 million. Finally, existing home sales are also projected to fall for a third straight month to a seasonally adjusted annual rate of 4.24 million units, marking the 15th monthly decline over the last 16 months.
For more news, information, and analysis, visit VettaFi | ETF Trends.
