
Several key economic indicators are released every week to help provide insight into the overall health of the U.S. economy. Last week was packed with housing-related data that could impact home builders and residential real-estate ETFs such as the Invesco Dynamic Building & Construction ETF (PKB), the iShares U.S. Home Construction ETF (ITB), the SPDR S&P Homebuilders ETF (XHB), and the iShares Residential and Multisector Real Estate ETF (REZ). In this article, we take a deeper look into key housing releases from the past week to gain valuable insights into the current state of the housing market and, by extension, the broader economy.
Policymakers and advisors closely monitor economic indicators to understand recession risk and the direction of interest rates. The data can ultimately impact business decisions and financial markets. In the week ending on July 20, the SPDR S&P 500 ETF Trust (SPY) rose 0.58% while the Invesco S&P 500® Equal Weight ETF (RSP) was up 0.61%. At their previous meeting, the Fed voted to leave interest rates unchanged. However, they indicated plans for two more rate hikes for 2023, with one at this week’s meeting all but certain.
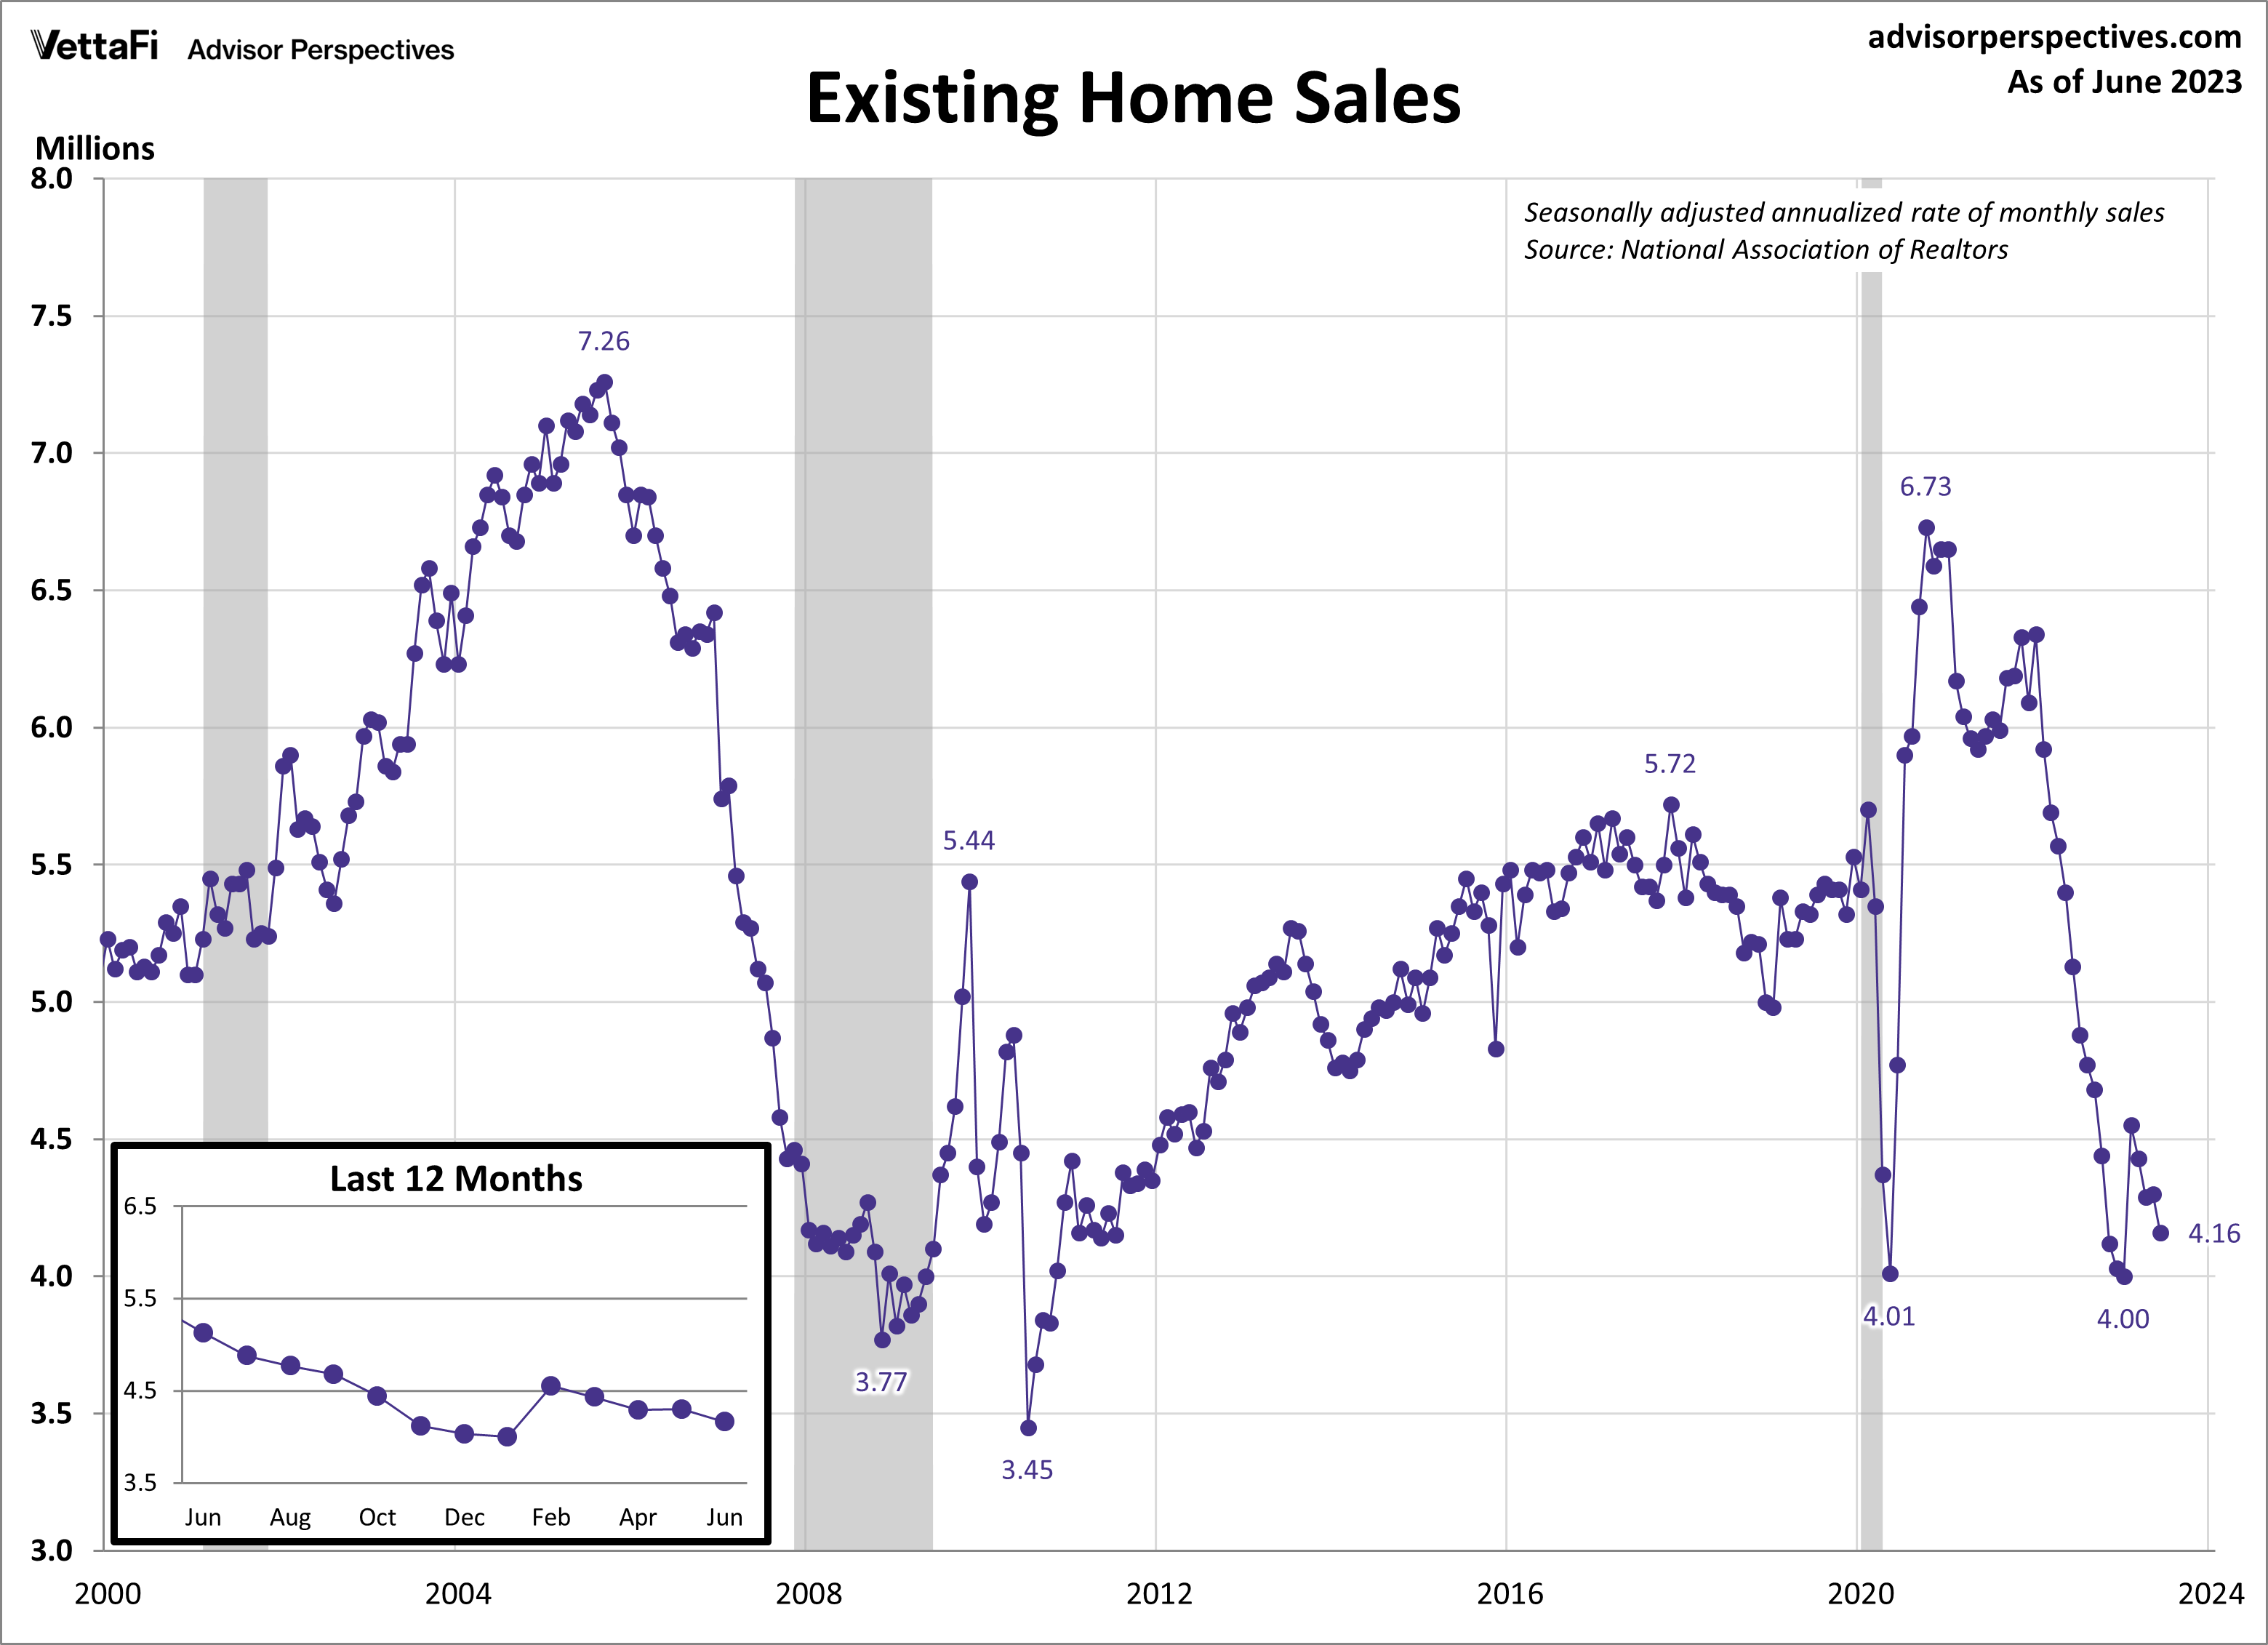
Existing Home Sales
Existing home sales retreated to their slowest pace since January as limited inventory and high mortgage rates continued to dampen sales. In June, existing home sales fell 3.3% to a seasonally adjusted annual rate of 4.16 million units. A drop in existing home sales compared to the previous month was expected. However, the latest reading was even further below expectations, with sales falling short of the projected 4.20 million units.
Increasing mortgage rates continue to play a significant role in limiting the existing home inventory. Many current homeowners are holding onto lower rates that they secured years ago. This makes them less motivated to sell their homes and potentially end up with a higher mortgage rate. This reluctance to sell, combined with strong demand, has created intense competition among homebuyers. Consequence of this include multiple offers and subsequent price hikes. In June, the median price for an existing home reached $410,200. This marked the fifth consecutive monthly increase and the second-highest level on record since January 1999.
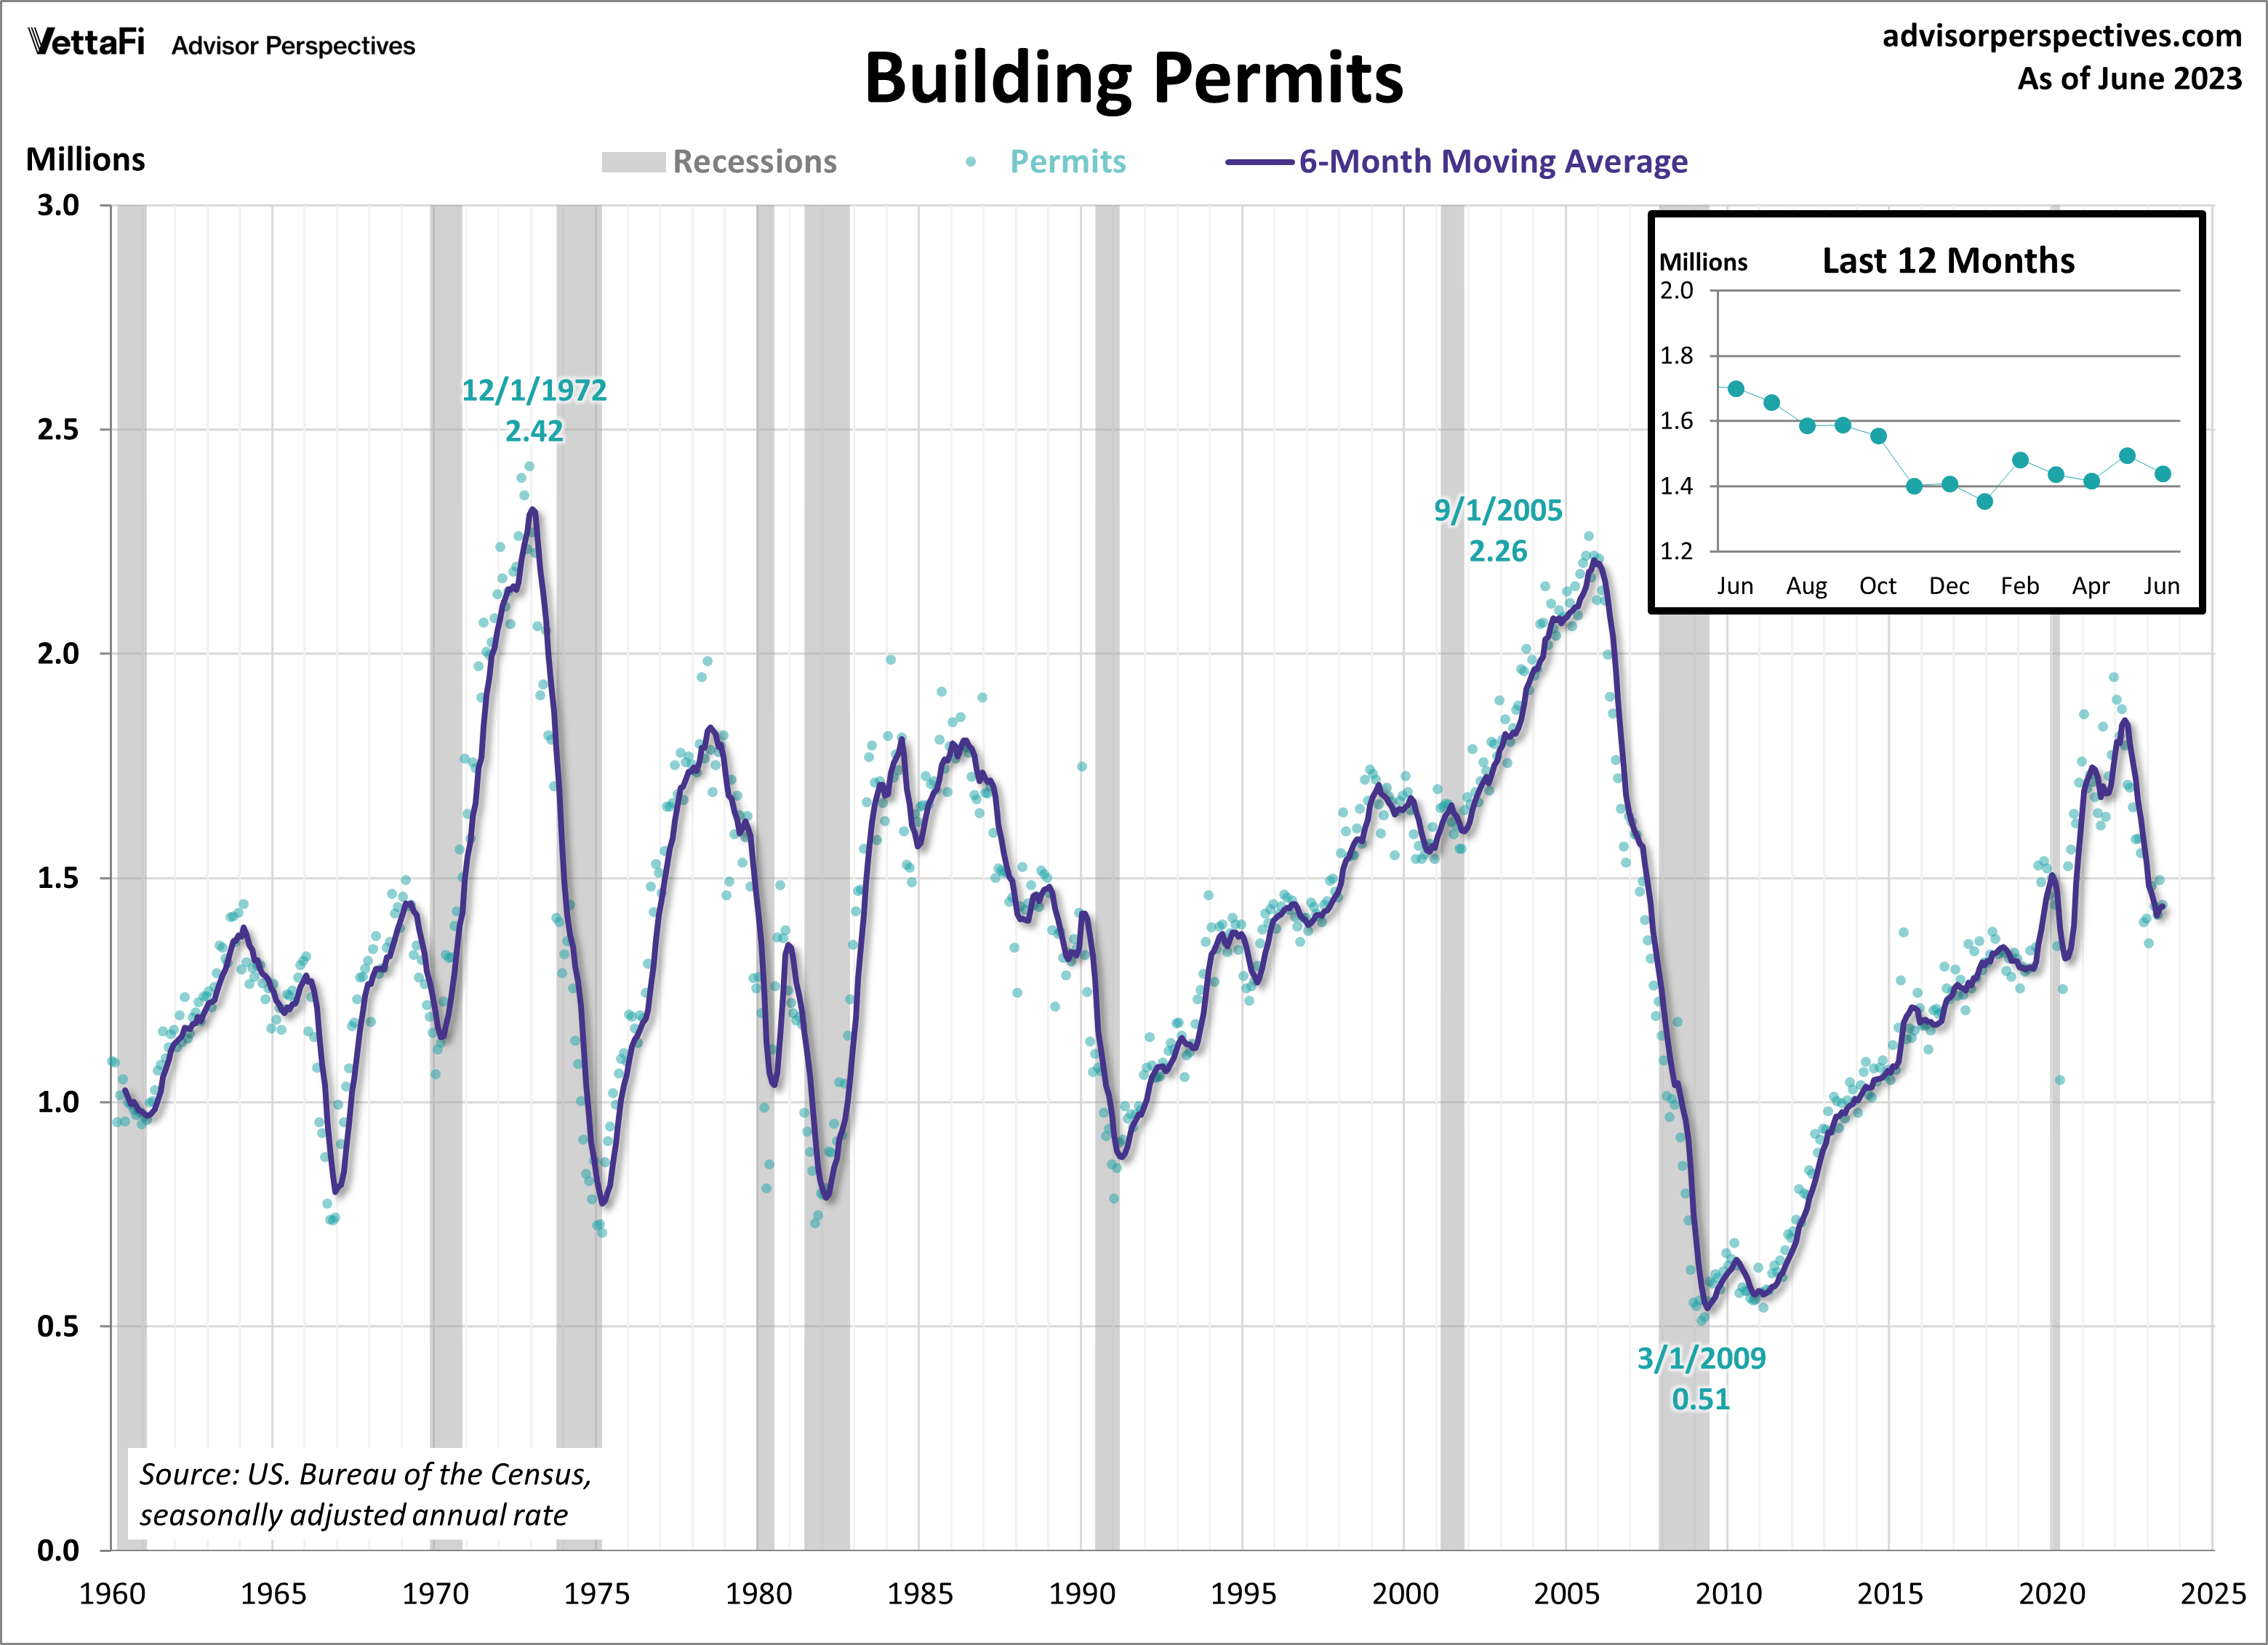
Building Permits
New residential building permits retreated in June after a brief uptick last month. Building permits provide a sense of future construction activity and therefore serve as a key indicator of housing market demand. Last month, building permits fell 3.7% from May to a seasonally adjusted annual rate of 1.440 million units. While a decline in permits was expected, the latest data was even lower than the anticipated 1.490 million units. Permits are down 15.3% compared to one year ago, marking the eleventh consecutive month of annual declines.
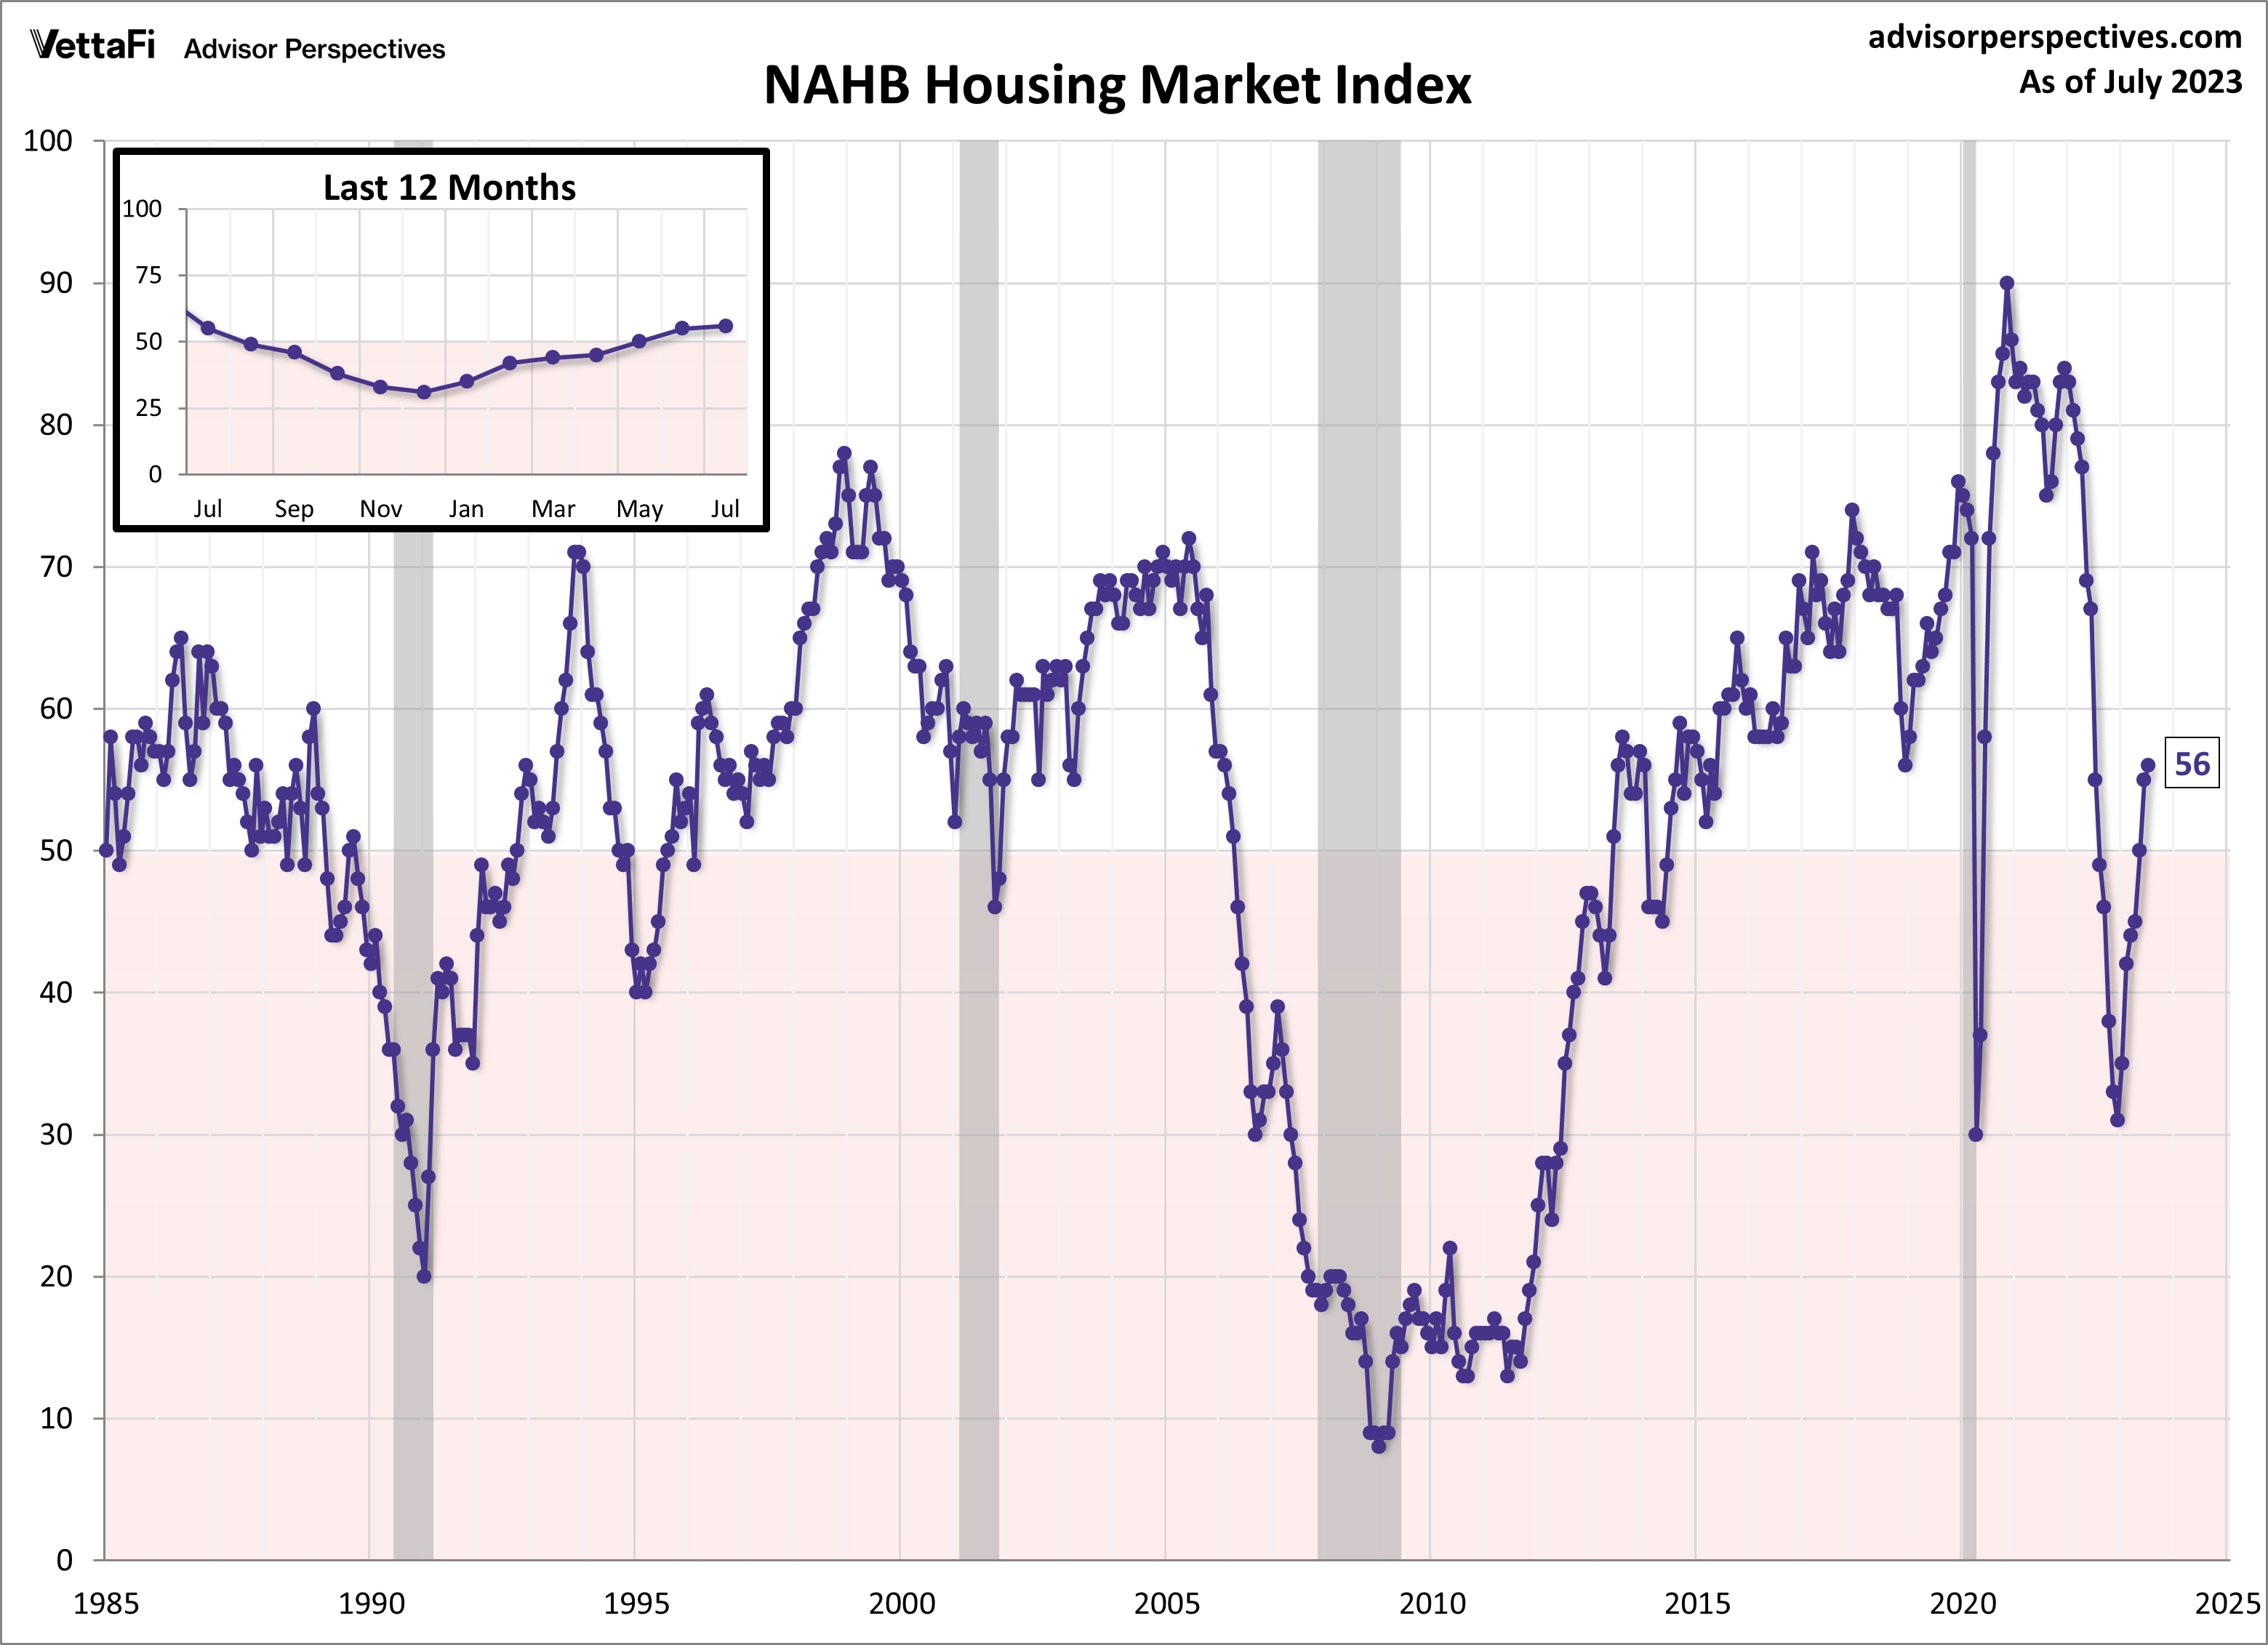
Despite the decline in building permits last month, builder confidence continues to grow. The NAHB housing market index, which measures builder opinion on current and future home sales, rose for a seventh straight month to its highest level since in 13 months. Despite various concerns such as rising mortgage rates, elevated construction costs, and limited lot availability, home builders remain cautiously optimistic due to low levels in existing homes inventory.
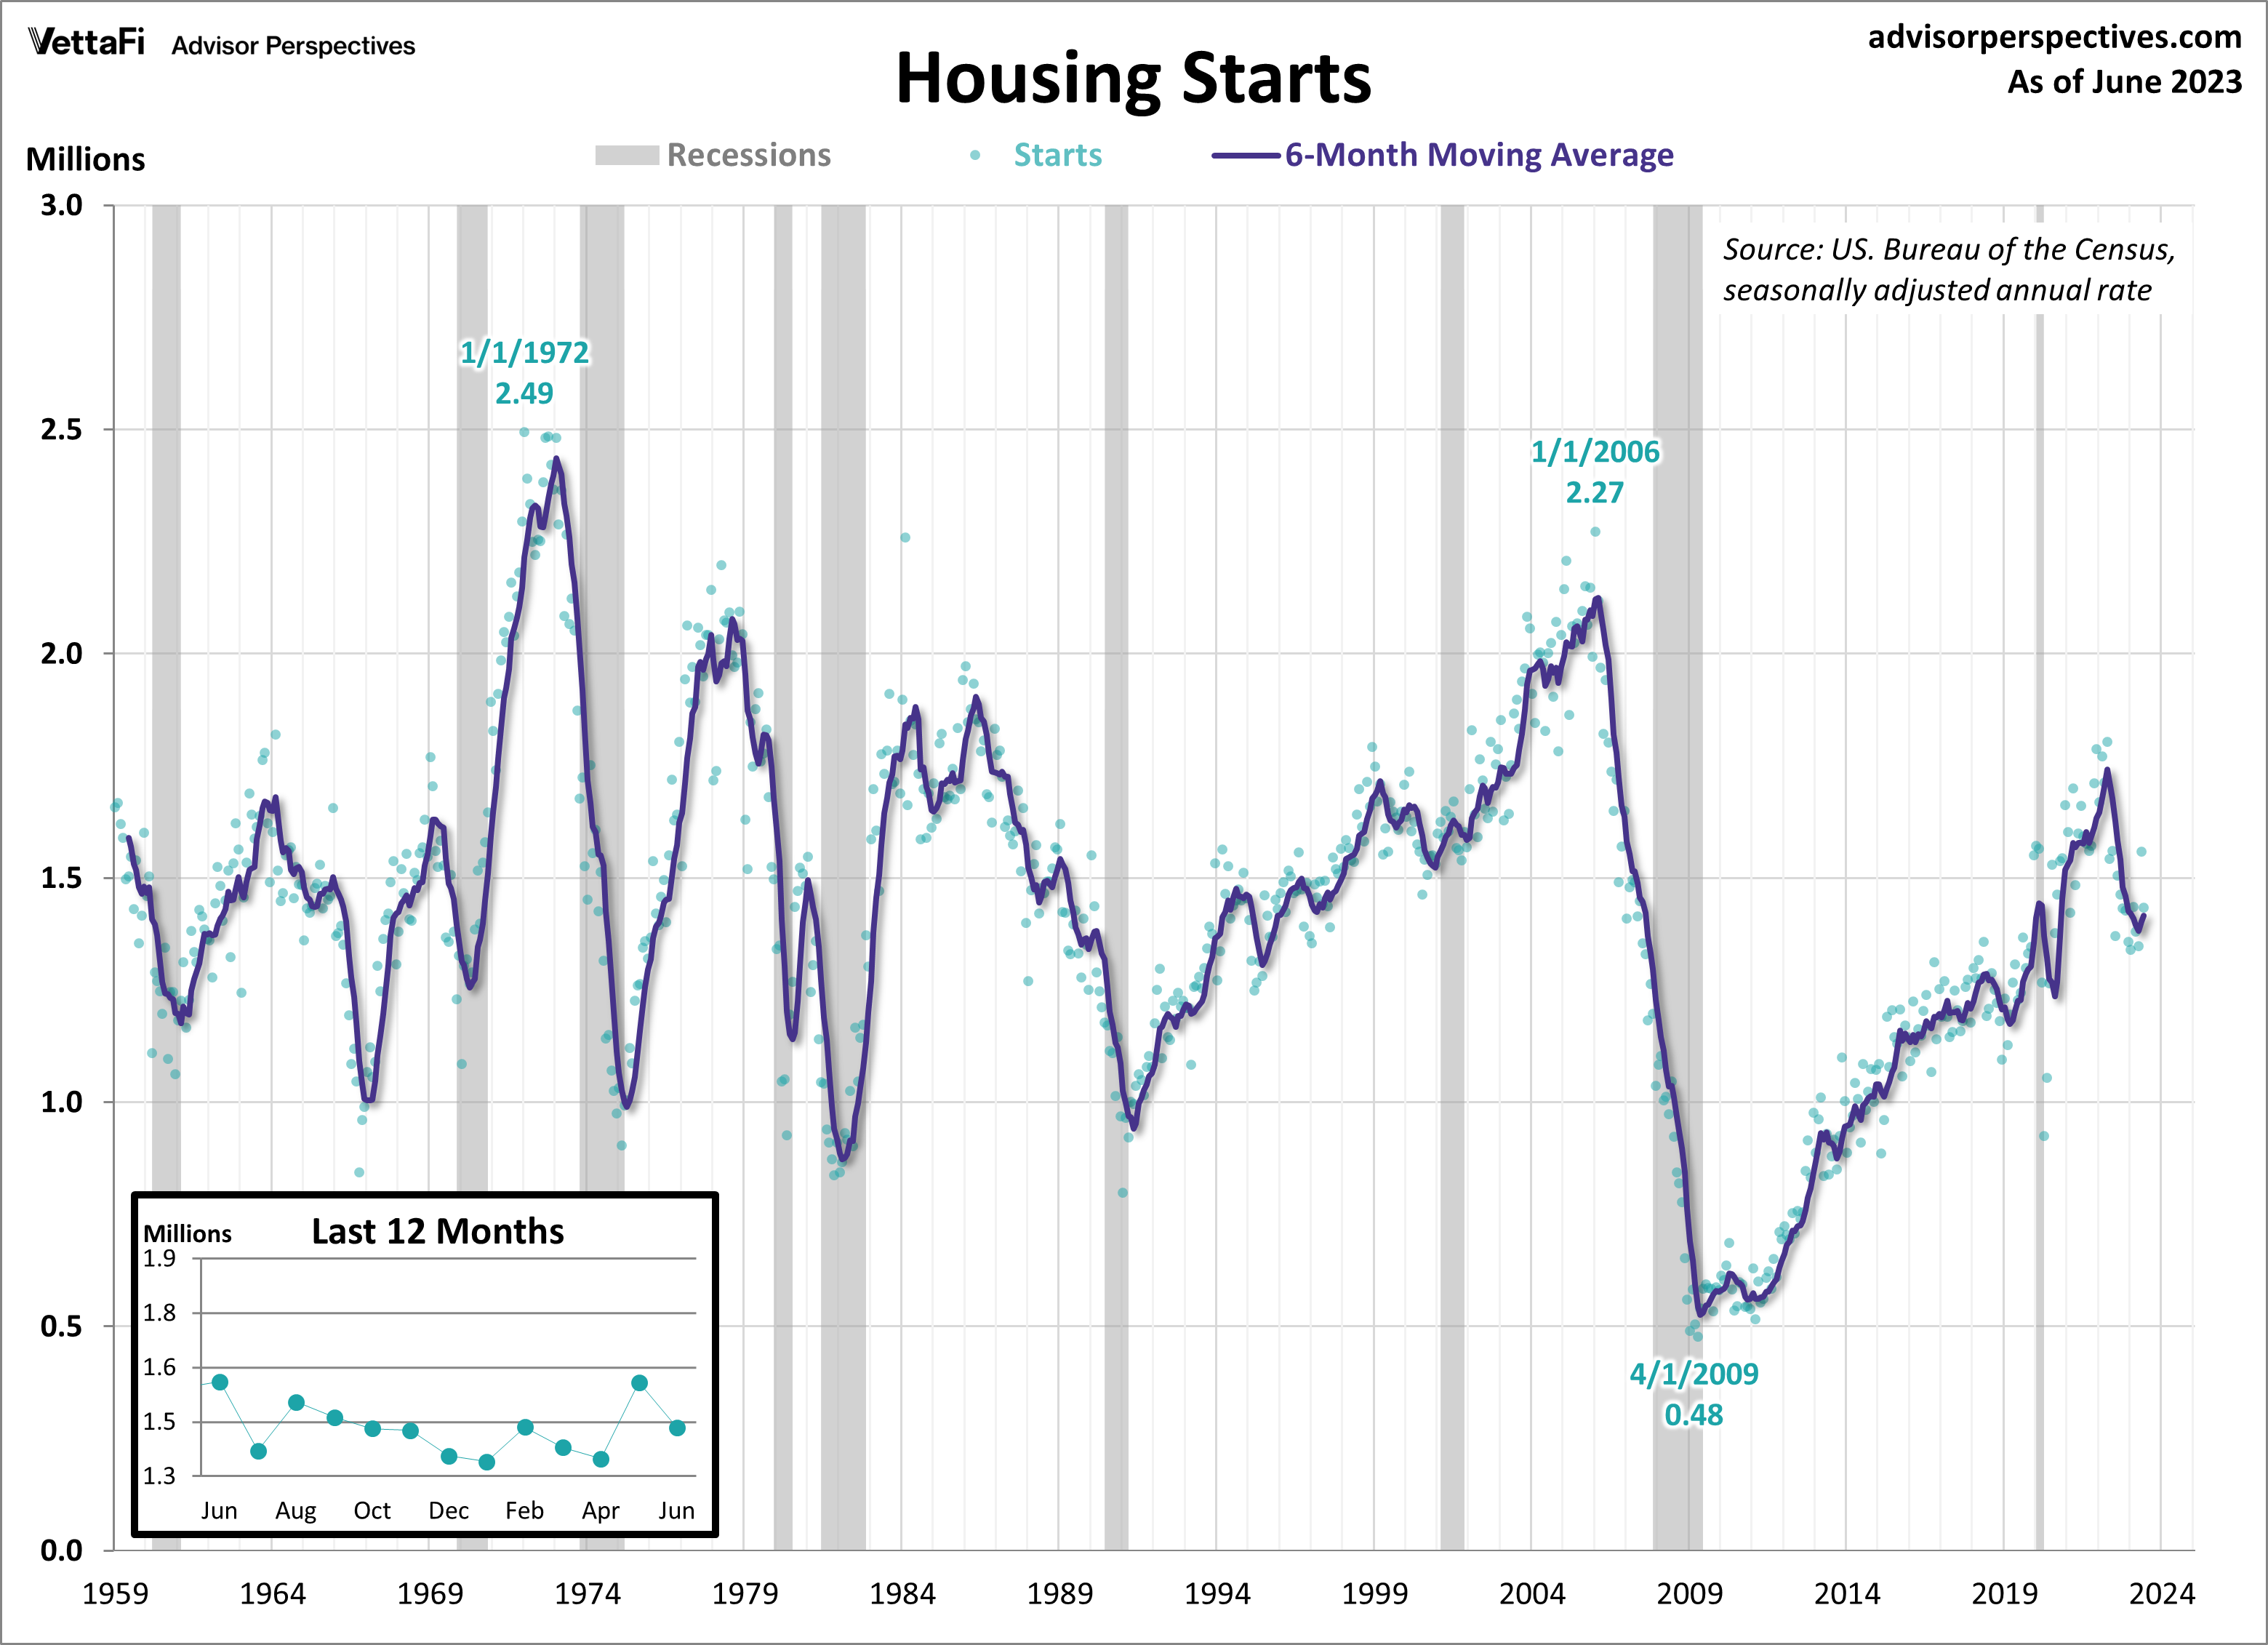
Housing Starts
New home construction unexpectedly tumbled last month, experiencing its sharpest decline in almost a year. In June, housing starts fell 8.0% to a seasonally adjusted annual rate of 1.434 million units. Housing starts were expected to increase by 7.2% from the previous month. The latest monthly decline comes on the heels of one of the strongest months for new home constructions in over two years. Furthermore, housing starts have fallen 8.1% from one year ago. A breakdown of the data showed that both single- and multi-family units saw a decrease in construction activity last month. With limited options in the resale market, consumers have increasingly turned their attention to new construction housing. However, rising mortgage rates and construction supply issues may put a halt to recent months’ momentum.
Economic Indicators and the Week Ahead
The upcoming week will be packed with economic data. Keep an eye out for the highly anticipated 2023 Q2 GDP advance estimate, June’s PCE index data, and July’s readings of the Conference Board’s Consumer Confidence Index® and Michigan Consumer Sentiment Index. The data will provide insights into the country’s economic growth and how consumers are feeling towards the overall state of the economy.
The 2023 Q2 advance estimate is forecasted to come in at 1.8%, down from the 2023 Q1 final estimate of 2.0%. The core PCE price index, the Fed’s preferred measure of inflation, will be released on Friday. Then, we’ll learn if inflation cooled for a second consecutive month or moved further away from the Fed’s target. Finally, consumer attitudes are expected to have improved yet again from last month. The Conference Board’s Consumer Confidence Index® is predicted to rise for a second straight month to 113.0. The final report for the Michigan Consumer Sentiment Index is predicted to remain at the preliminary reading of 72.6, its highest level since July 2021. The data from these indexes could impact the Consumer Discretionary Select Sector SPDR ETF (XLY).
For more news, information, and analysis, visit the Portfolio Strategies Channel.
