
Several key economic indicators are released every week to help provide insight into the overall health of the U.S. economy. Last week had a heavy focus on housing-related data that could impact home builders and residential real estate ETFs such as the Invesco Dynamic Building & Construction ETF (PKB), the iShares U.S. Home Construction ETF (ITB), the SPDR S&P Homebuilders ETF (XHB), and the iShares Residential and Multisector Real Estate ETF (REZ). In this article, we take a deeper look into three key housing releases from the past week: existing home sales, building permits, and housing starts. By examining this data, we gain valuable insights into the current state of the housing market and the broader economy.
Policymakers and advisors closely monitor economic indicators to understand the direction of interest rates. The data can significantly impact business decisions and financial markets. In the week ending on June 22, the SPDR S&P 500 ETF Trust (SPY) fell 1.00%, while the Invesco S&P 500® Equal Weight ETF (RSP) was down 1.54%.
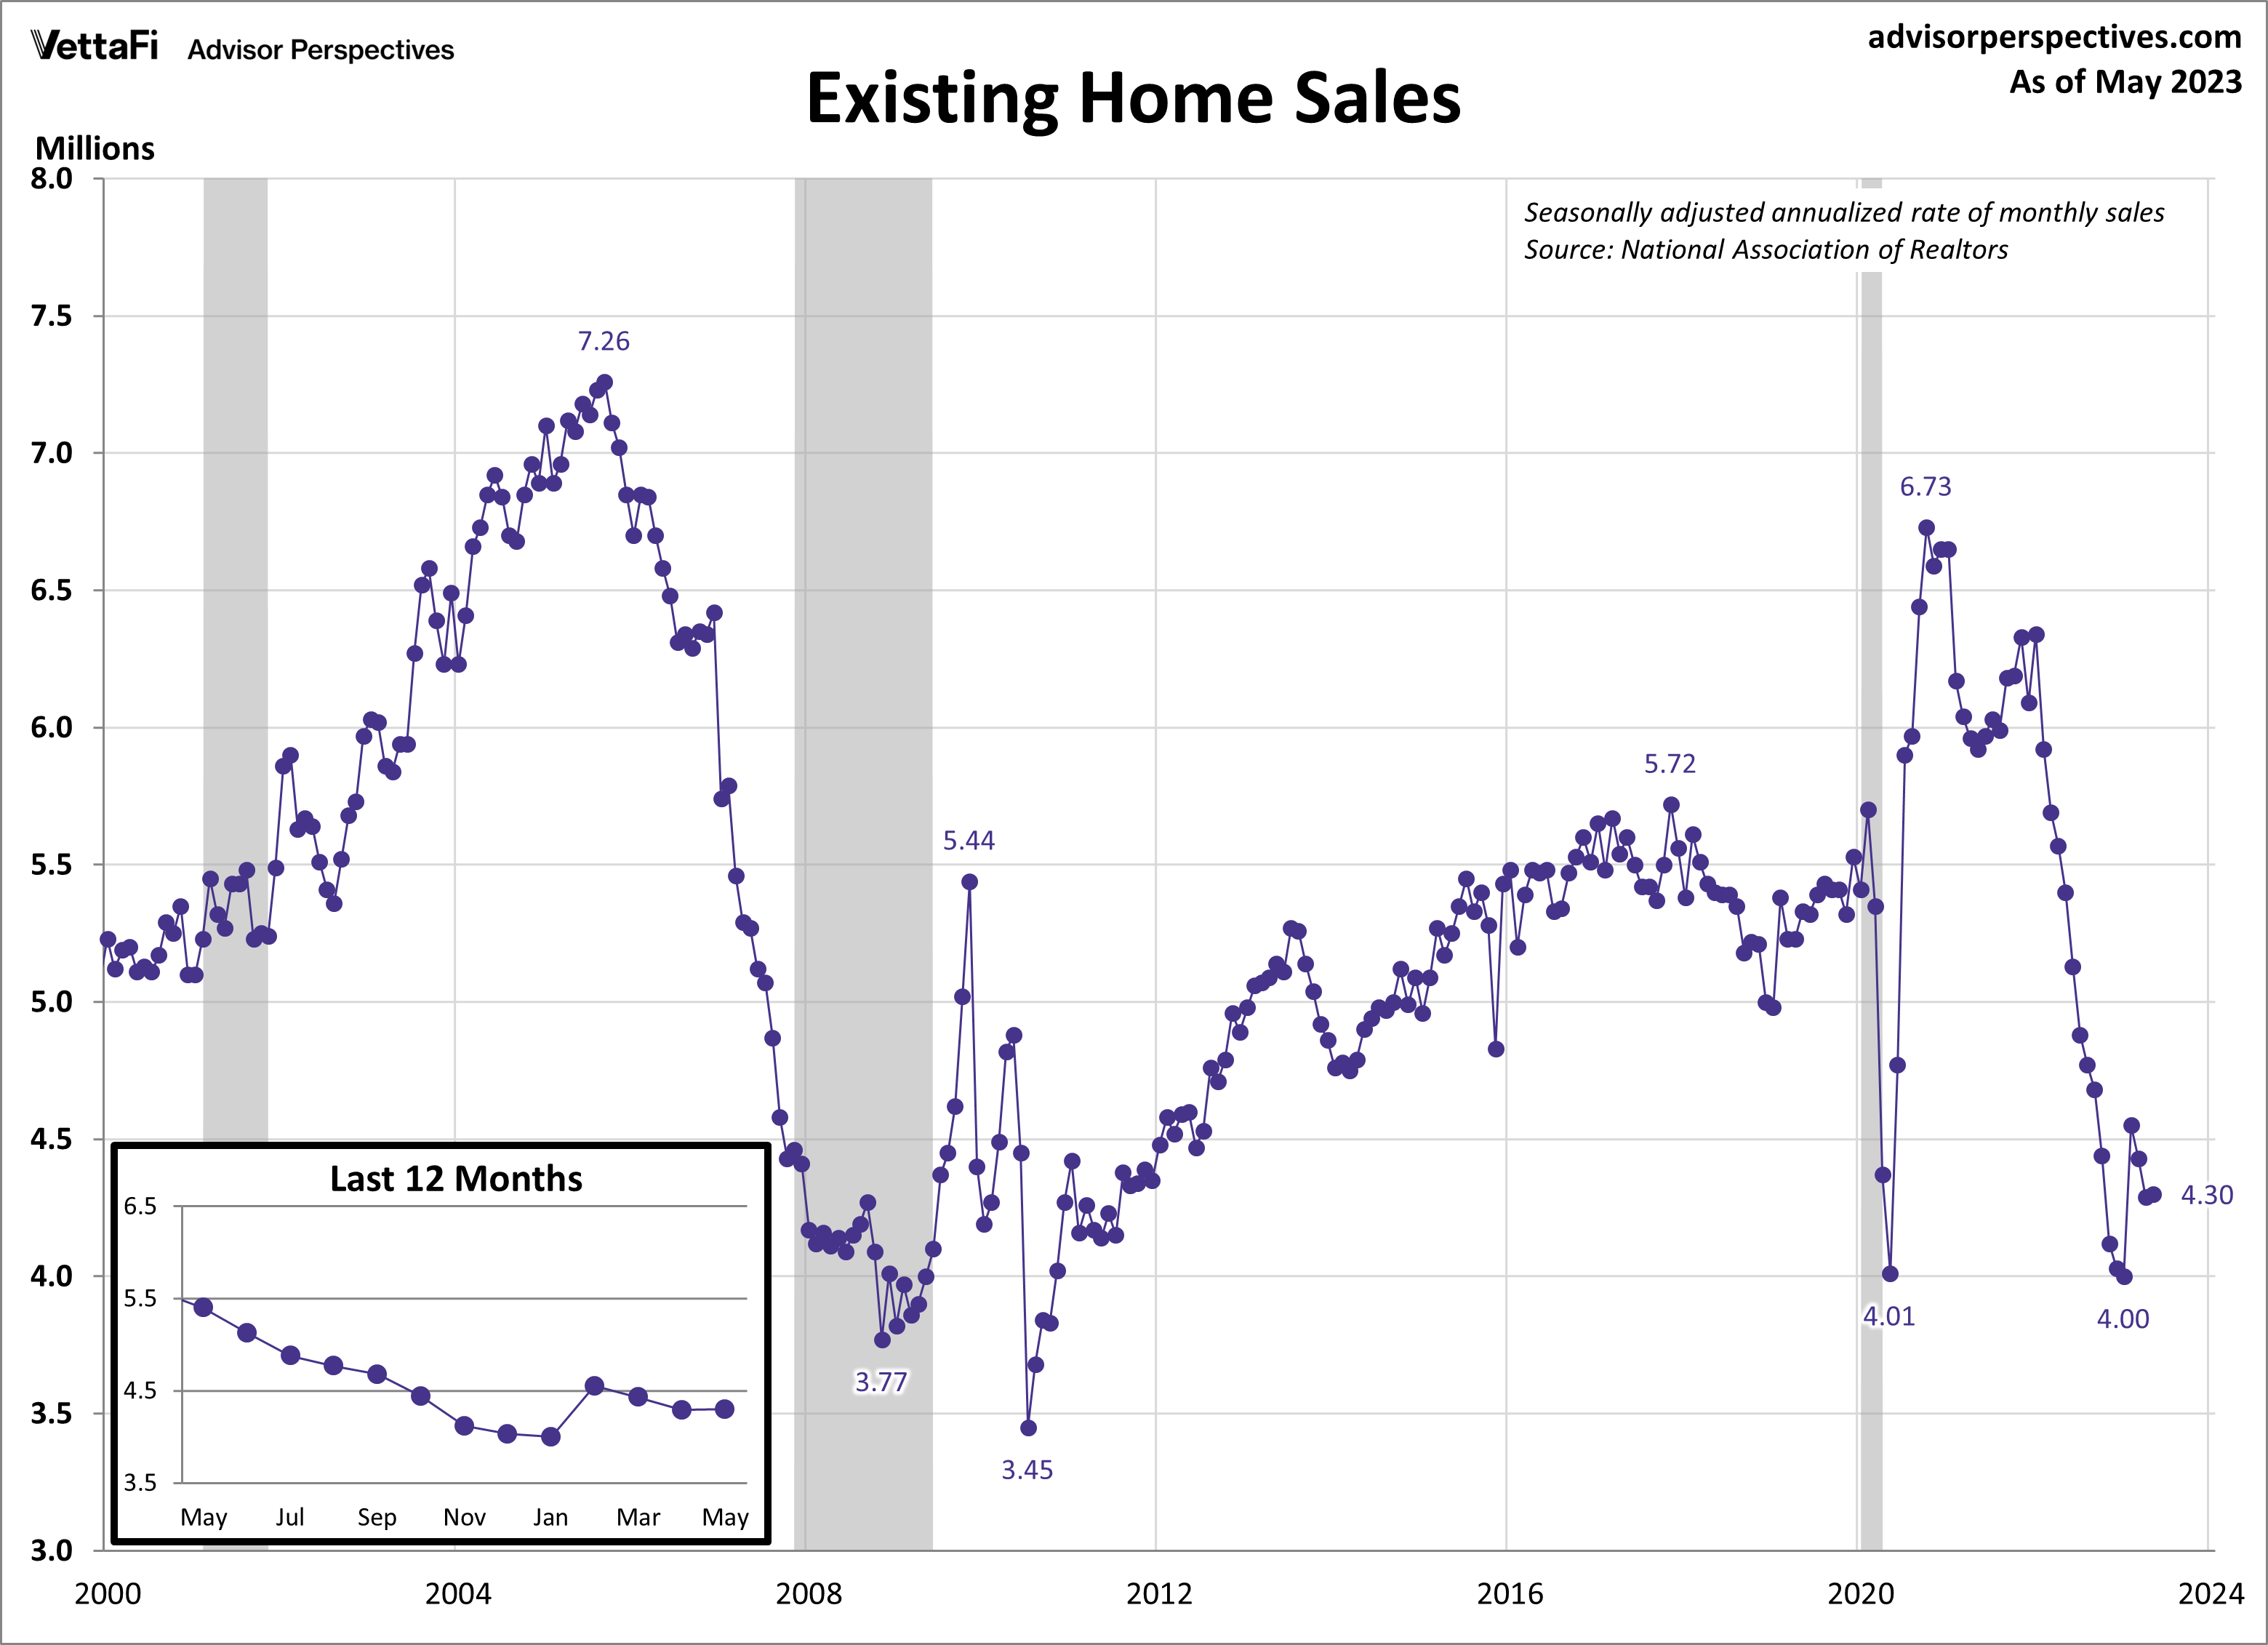
Existing Home Sales
Existing home sales unexpectedly inched up 0.2% in May. The sales data from May likely reflects home sales that went under contract in April. In that period, mortgage rates had somewhat stabilized, albeit at relatively high levels. As a result of the steady rates, existing home sales barely budged from a seasonally adjusted annual rate of 4.29 million units in April to 4.30 million units in May. The latest data was above expectations that home sales were going to drop to 4.25 million units.
Mortgage rates also play a big role in why existing home inventory is extremely limited. Many current homeowners are sitting at lower rates than they locked in years ago. Thus, they are less motivated to sell their home only to get stuck with a higher rate. The tight supply coupled with strong demand continues to create competition among homebuyers. This results in multiple offers and subsequent price hikes. In May, the median price for an existing home reached $396,100, marking the fourth consecutive monthly increase.
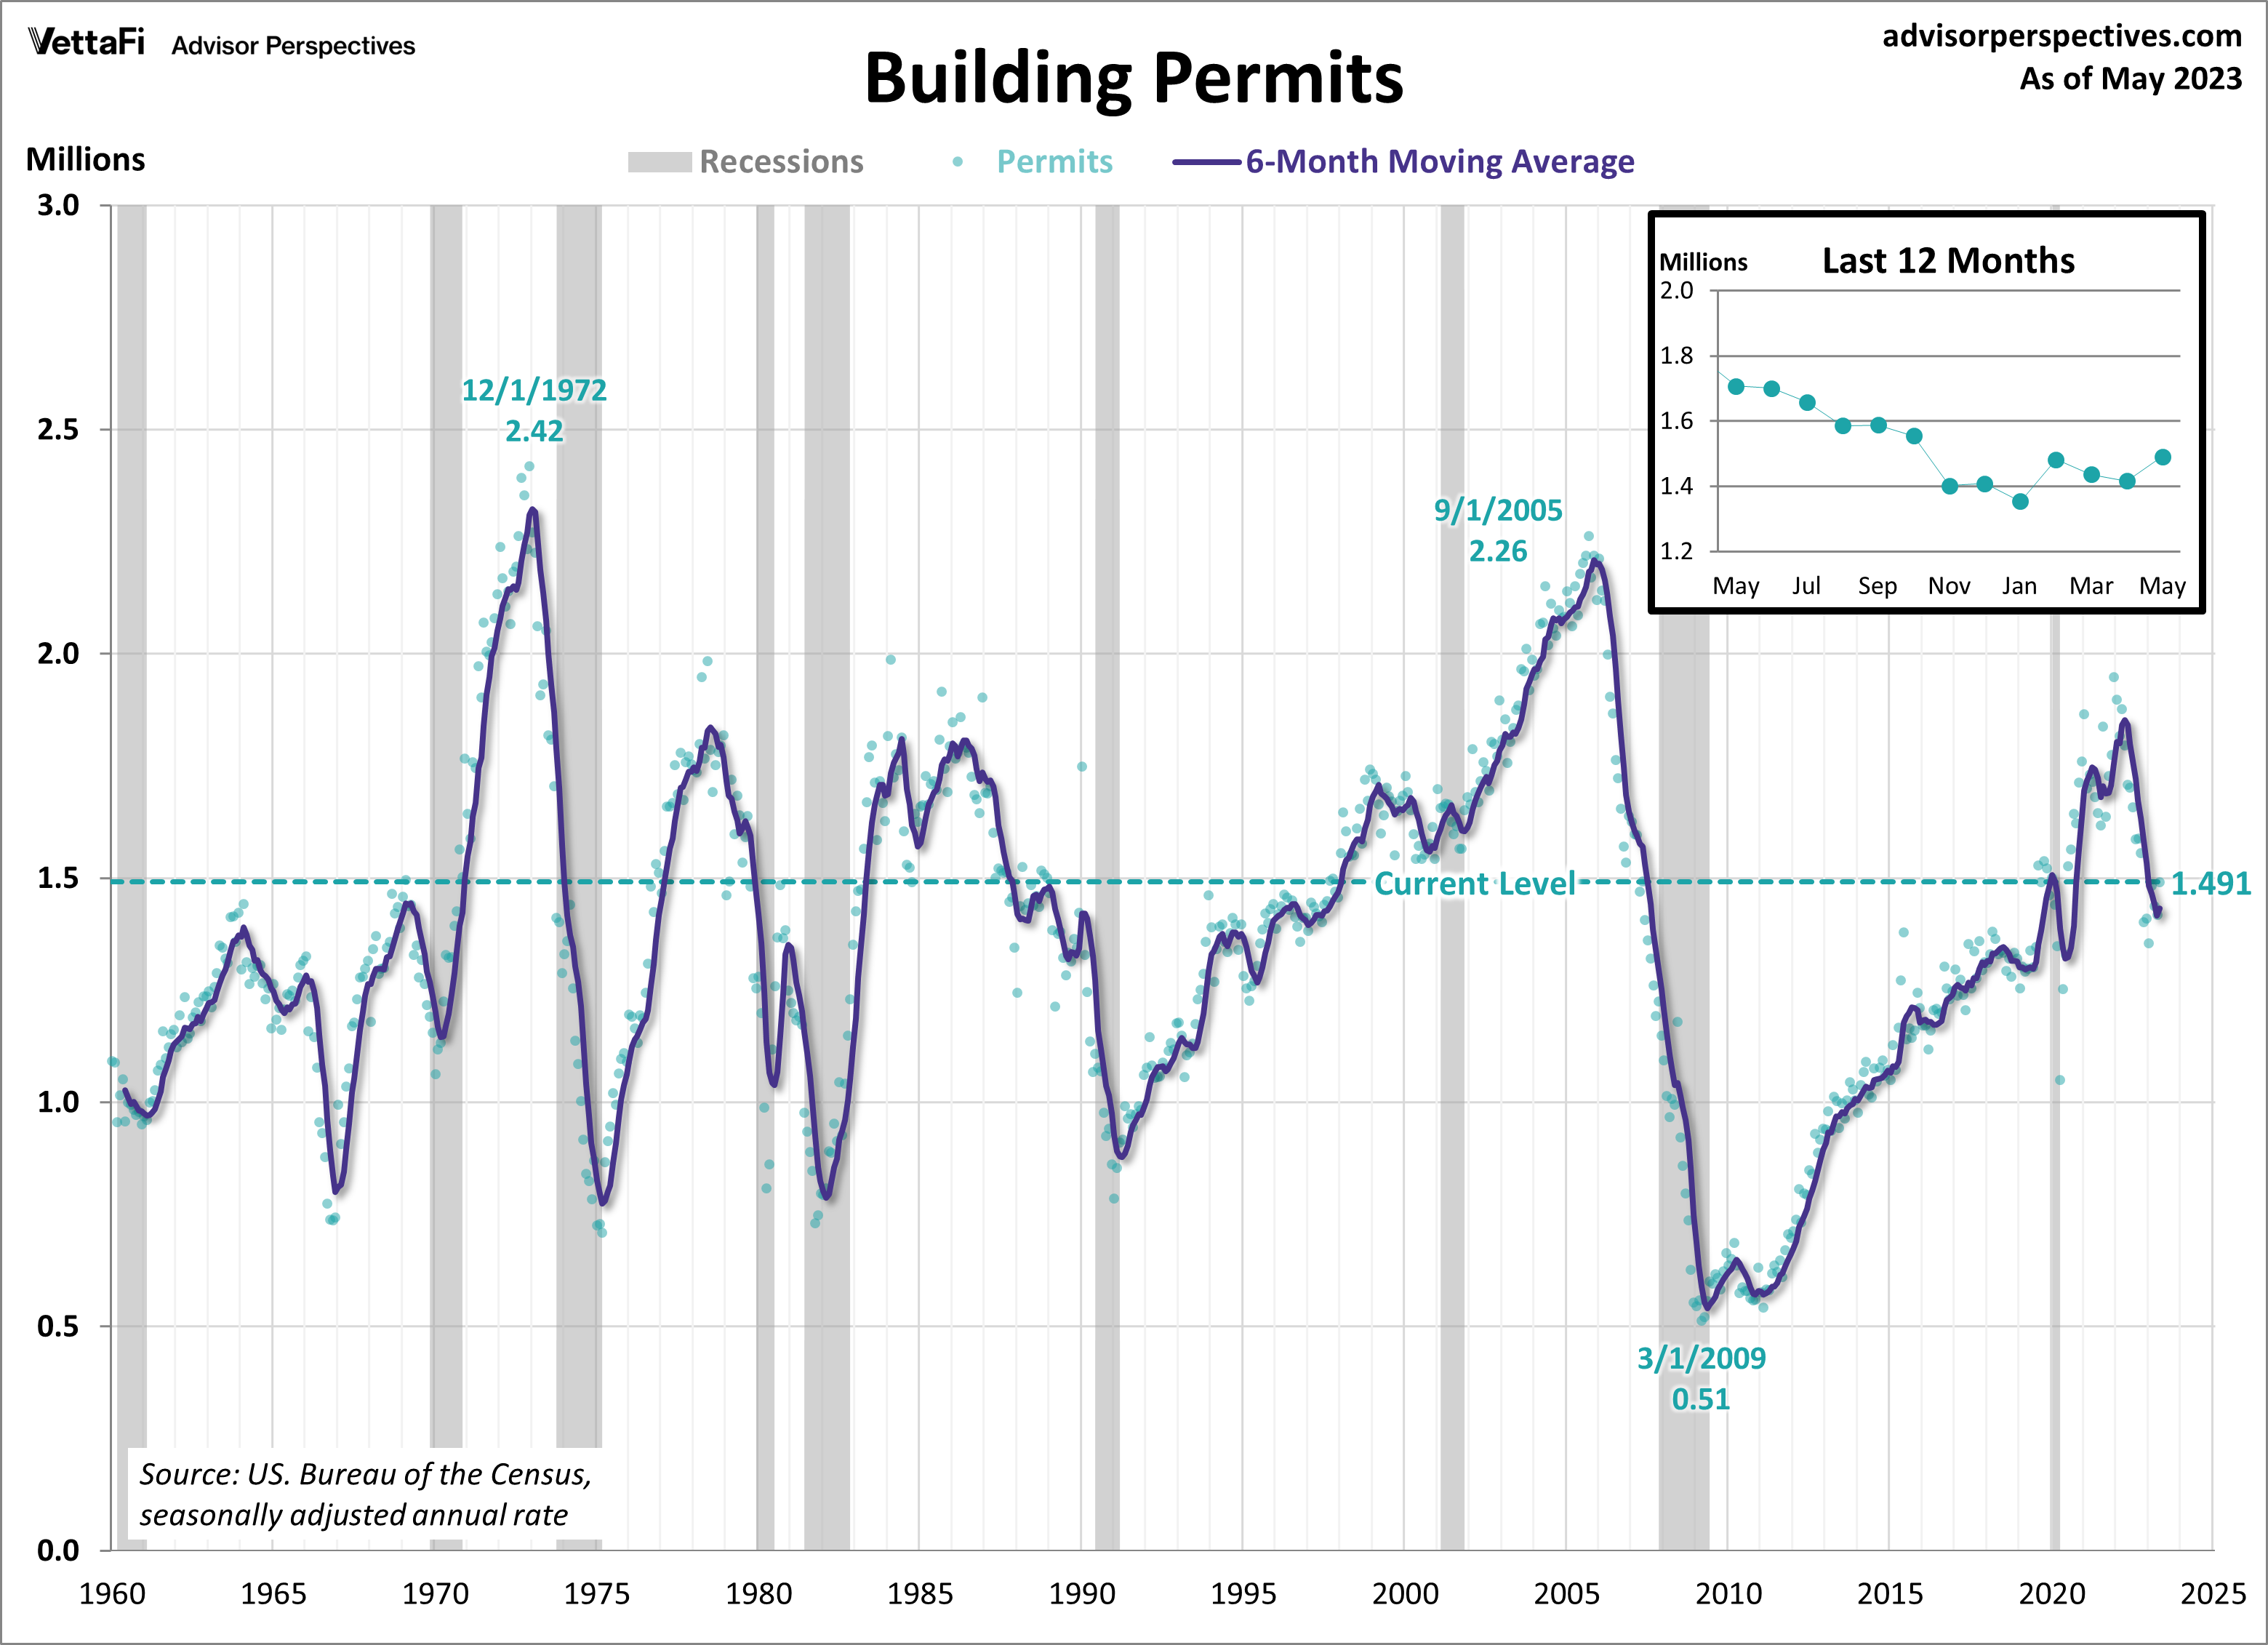
Building Permits
New residential building permits bounced back in May after retreating over the past few months. Building permits provide a sense of future construction activity and therefore serve as a key indicator of housing market demand. Last month, building permits rose 5.2% from April to a seasonally adjusted annual rate of 1.491 million units. This reading exceeded expectations, surpassing the anticipated 1.425 million units. However, permits are down 12.7% compared to one year ago, marking the tenth consecutive month of annual declines.
The growth in building permits seen in May reaffirms the increasing builder confidence in recent months. The NAHB housing market index, which measures builder opinion on current and future home sales, rose for a sixth straight month to its highest level in 11 months. Despite tightening credit conditions, home builders remain cautiously optimistic due to low levels in existing homes inventory and improvements in supply chain efficiency.
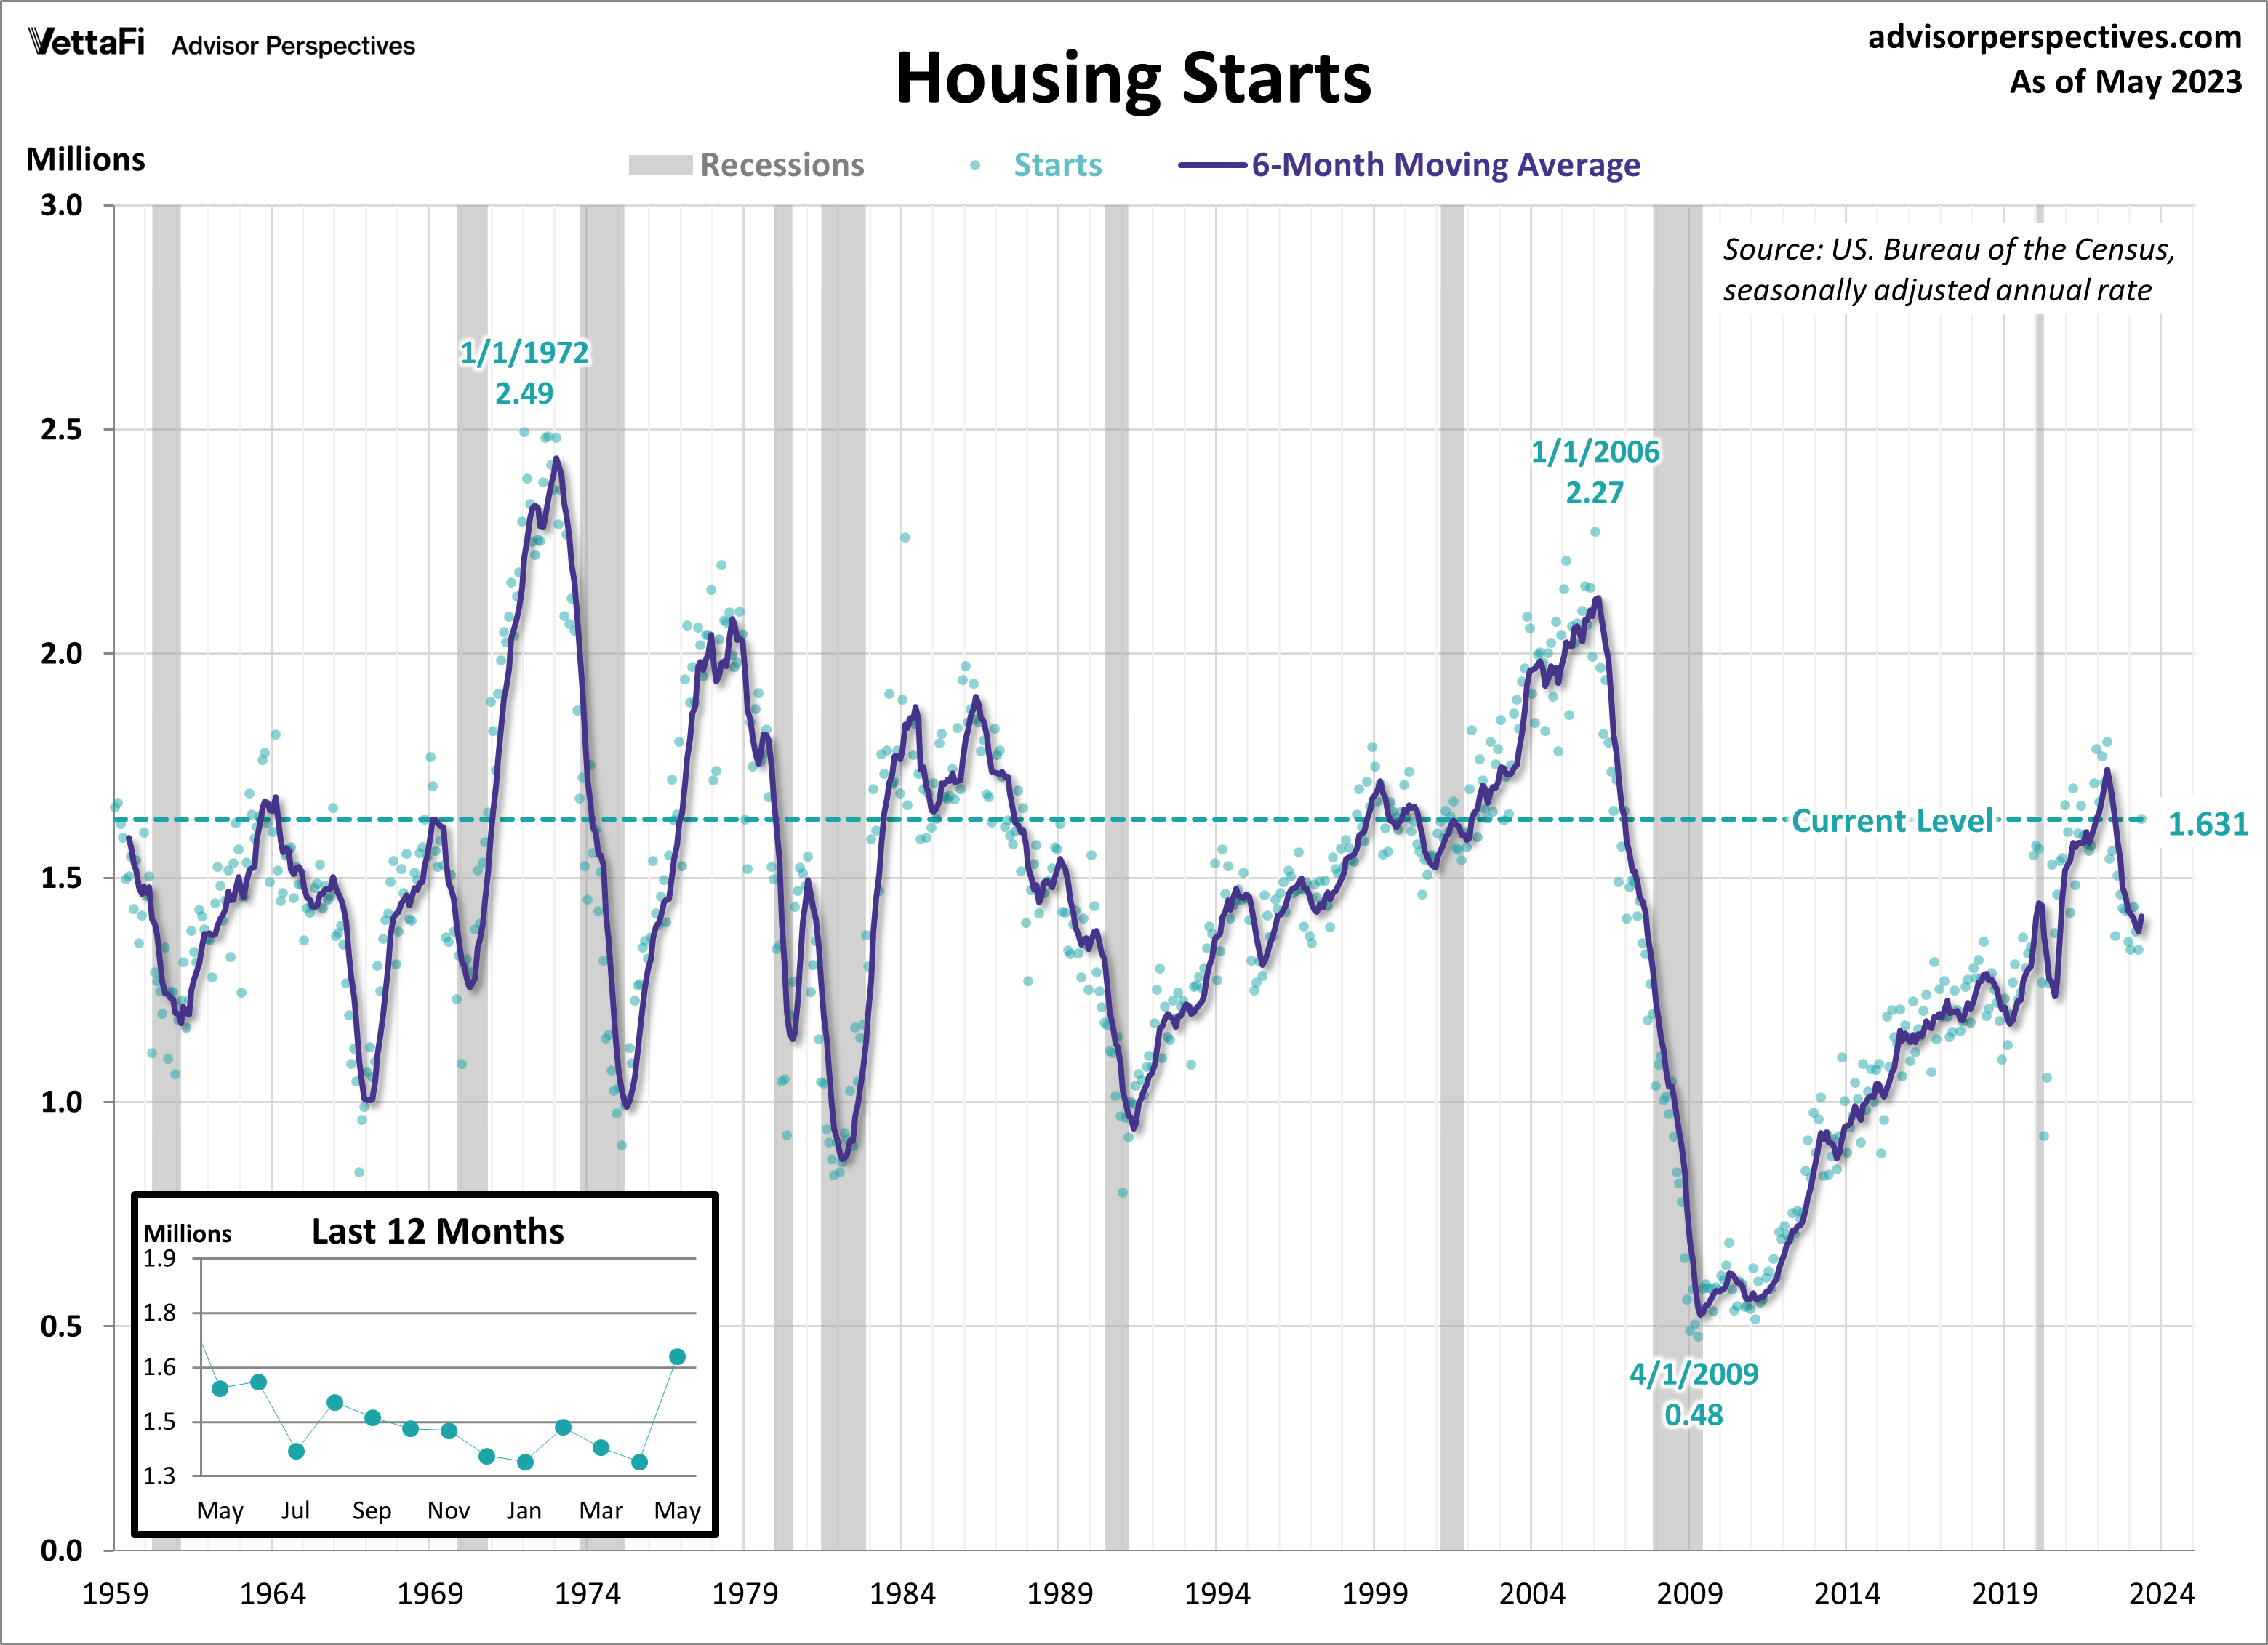
Housing Starts
New home construction surged to its highest level in over a year as inventory of existing homes remains constrained. In May, housing starts rose 21.7% to a seasonally adjusted annual rate of 1.631 million units, well above the forecasted 1.400 million units. The latest monthly increase marks the most significant jump in housing starts since 2016. A breakdown of the data showed that both single and multi-family units saw an increase in construction activity last month. Furthermore, housing starts have risen 5.7% from one year ago, marking the first annual increase in 13 months. With limited options in the resale market, consumers are increasingly turning their attention to new construction housing. Although the pace of new construction is still below the levels seen during the building surge a few years ago, the strong demand for new homes may eventually bring housing starts back to those levels.
Economic Indicators and the Week Ahead
In the upcoming week, keep an eye out for the highly anticipated 2023 Q1 GDP third estimate, May’s PCE index data, and June’s readings of the Conference Board’s Consumer Confidence Index® and Michigan Consumer Sentiment Index. The data will provide insights into the country’s economic growth and how consumers feel about the overall state of the economy.
The 2023 Q1 third estimate is forecasted to come in at 1.4%. That’s up from the Q1 second estimate of 1.1% and down from the 2022 Q4 final estimate of 2.6%. The core PCE price index, the Fed’s preferred measure of inflation, will be released on Friday where we’ll learn if inflation rose for a second consecutive month or if it resumed its slow downward trend. Finally, consumer attitudes are expected to have improved from last month. The Conference Board’s Consumer Confidence Index® is predicted to rise for the first time in three months to 104.0. The final report for the Michigan Consumer Sentiment Index is predicted to remain at the preliminary reading of 63.9. The data from these indexes could impact the Consumer Discretionary Select Sector SPDR ETF (XLY).
For more news, information, and analysis, visit the Portfolio Strategies Channel.
