

Several key economic indicators are released every week to help provide insight into the overall health of the U.S. economy. In this article, we examine three of the data points from last week’s abundance of releases – March’s personal consumption expenditures (PCE), Q1 gross domestic product (GDP), and April’s consumer confidence index.
Economic indicators, such as these three, are closely watched by policymakers and advisors trying to understand the direction of interest rates because the data can have a significant impact on business decisions and financial markets. In the week ending on April 27th, the SPDR S&P 500 ETF Trust (SPY) rose 0.13% while the Invesco S&P 500® Equal Weight ETF (RSP) was down 0.92%. The next interest rate decision meeting will be held this Wednesday, with the Fed expected to implement one more 25-basis-point hike.
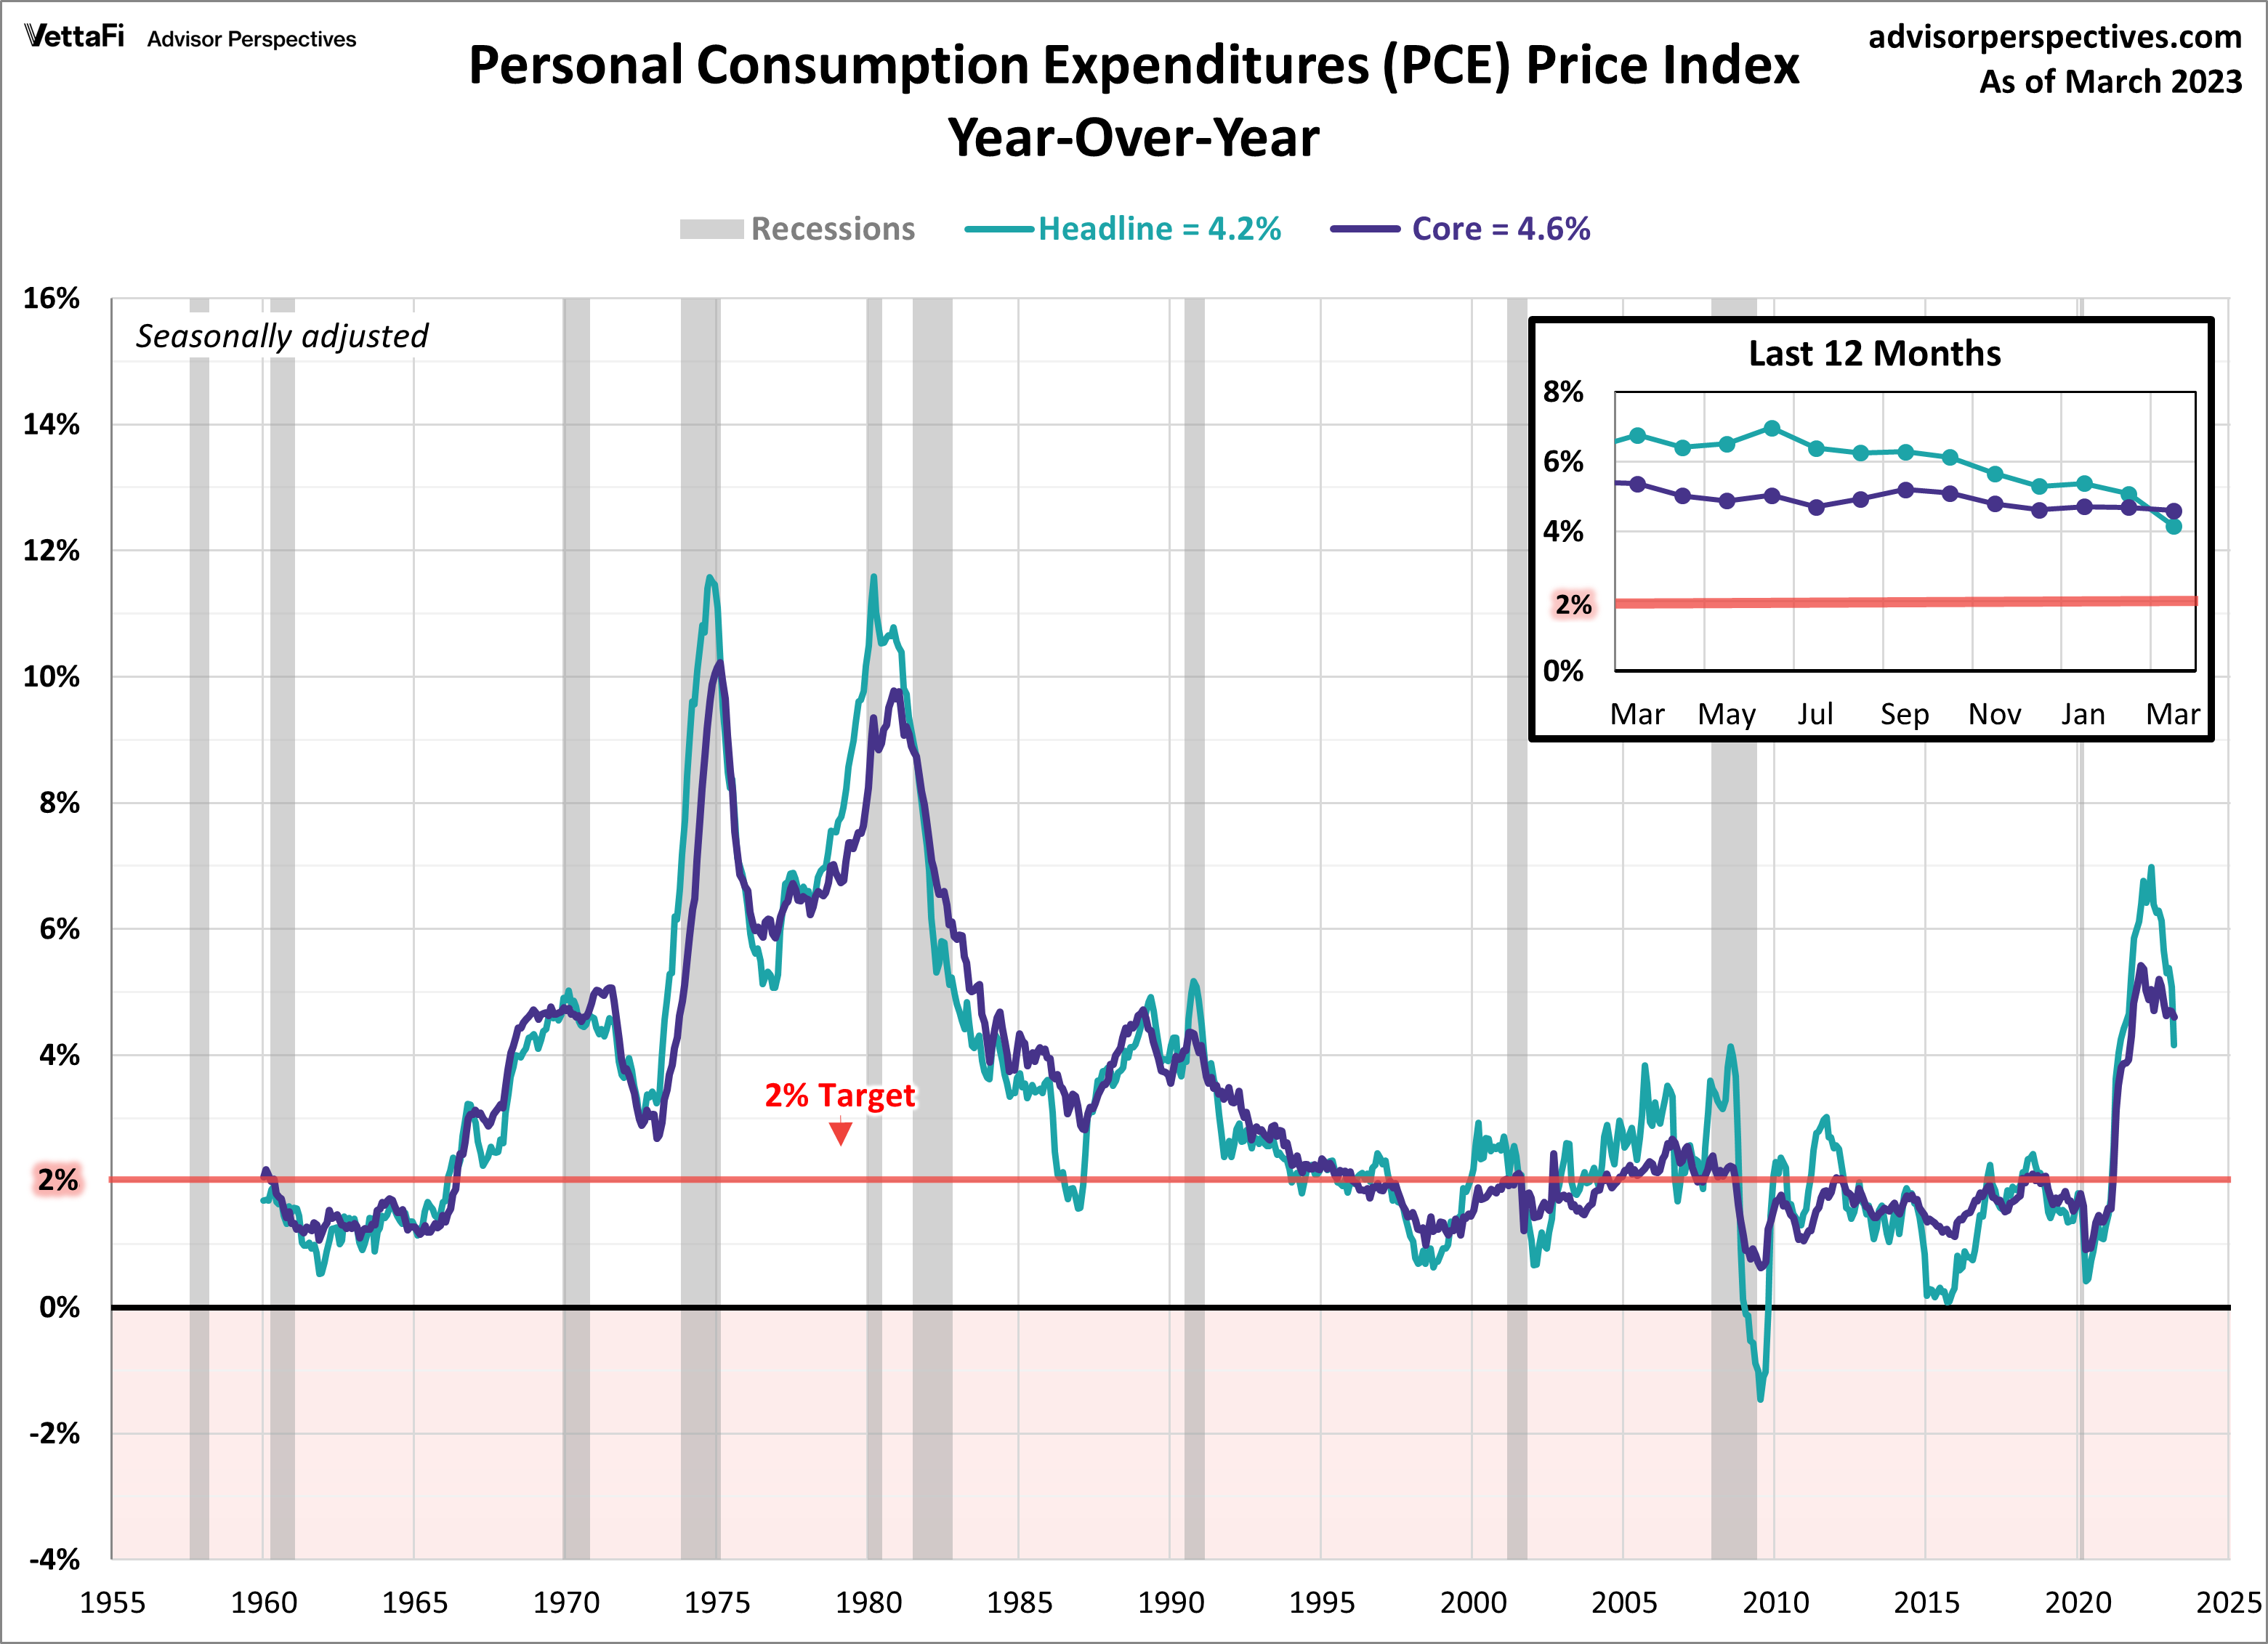
Personal Consumption Expenditures (PCE)
In March, the personal consumption expenditure (PCE) price index showed that consumer spending rose by 4.6% compared to a year ago, down from 5.1% in February. This month’s reading is the second consecutive month the index has declined and marks the lowest annual change since May 2021. Core PCE, which excludes food and energy and is the Fed’s preferred measure of inflation, came in slightly above the expected 4.5% annual increase at 4.6% year-over-year in March. This month’s figure is down from 4.7% in February and is the lowest level for core PCE since October 2021. On a monthly basis, both the headline and core PCE price index increased 0.1% and 0.3% from February, respectively. While the headline number was slower than anticipated, the core number was in line with expectations. While March’s numbers offer further evidence that inflation is cooling and have prompted hopes that interest rate hikes could be ending soon, PCE remains well above the Fed’s 2% target rate and would need to decelerate at a quicker pace to reach that target anytime soon.
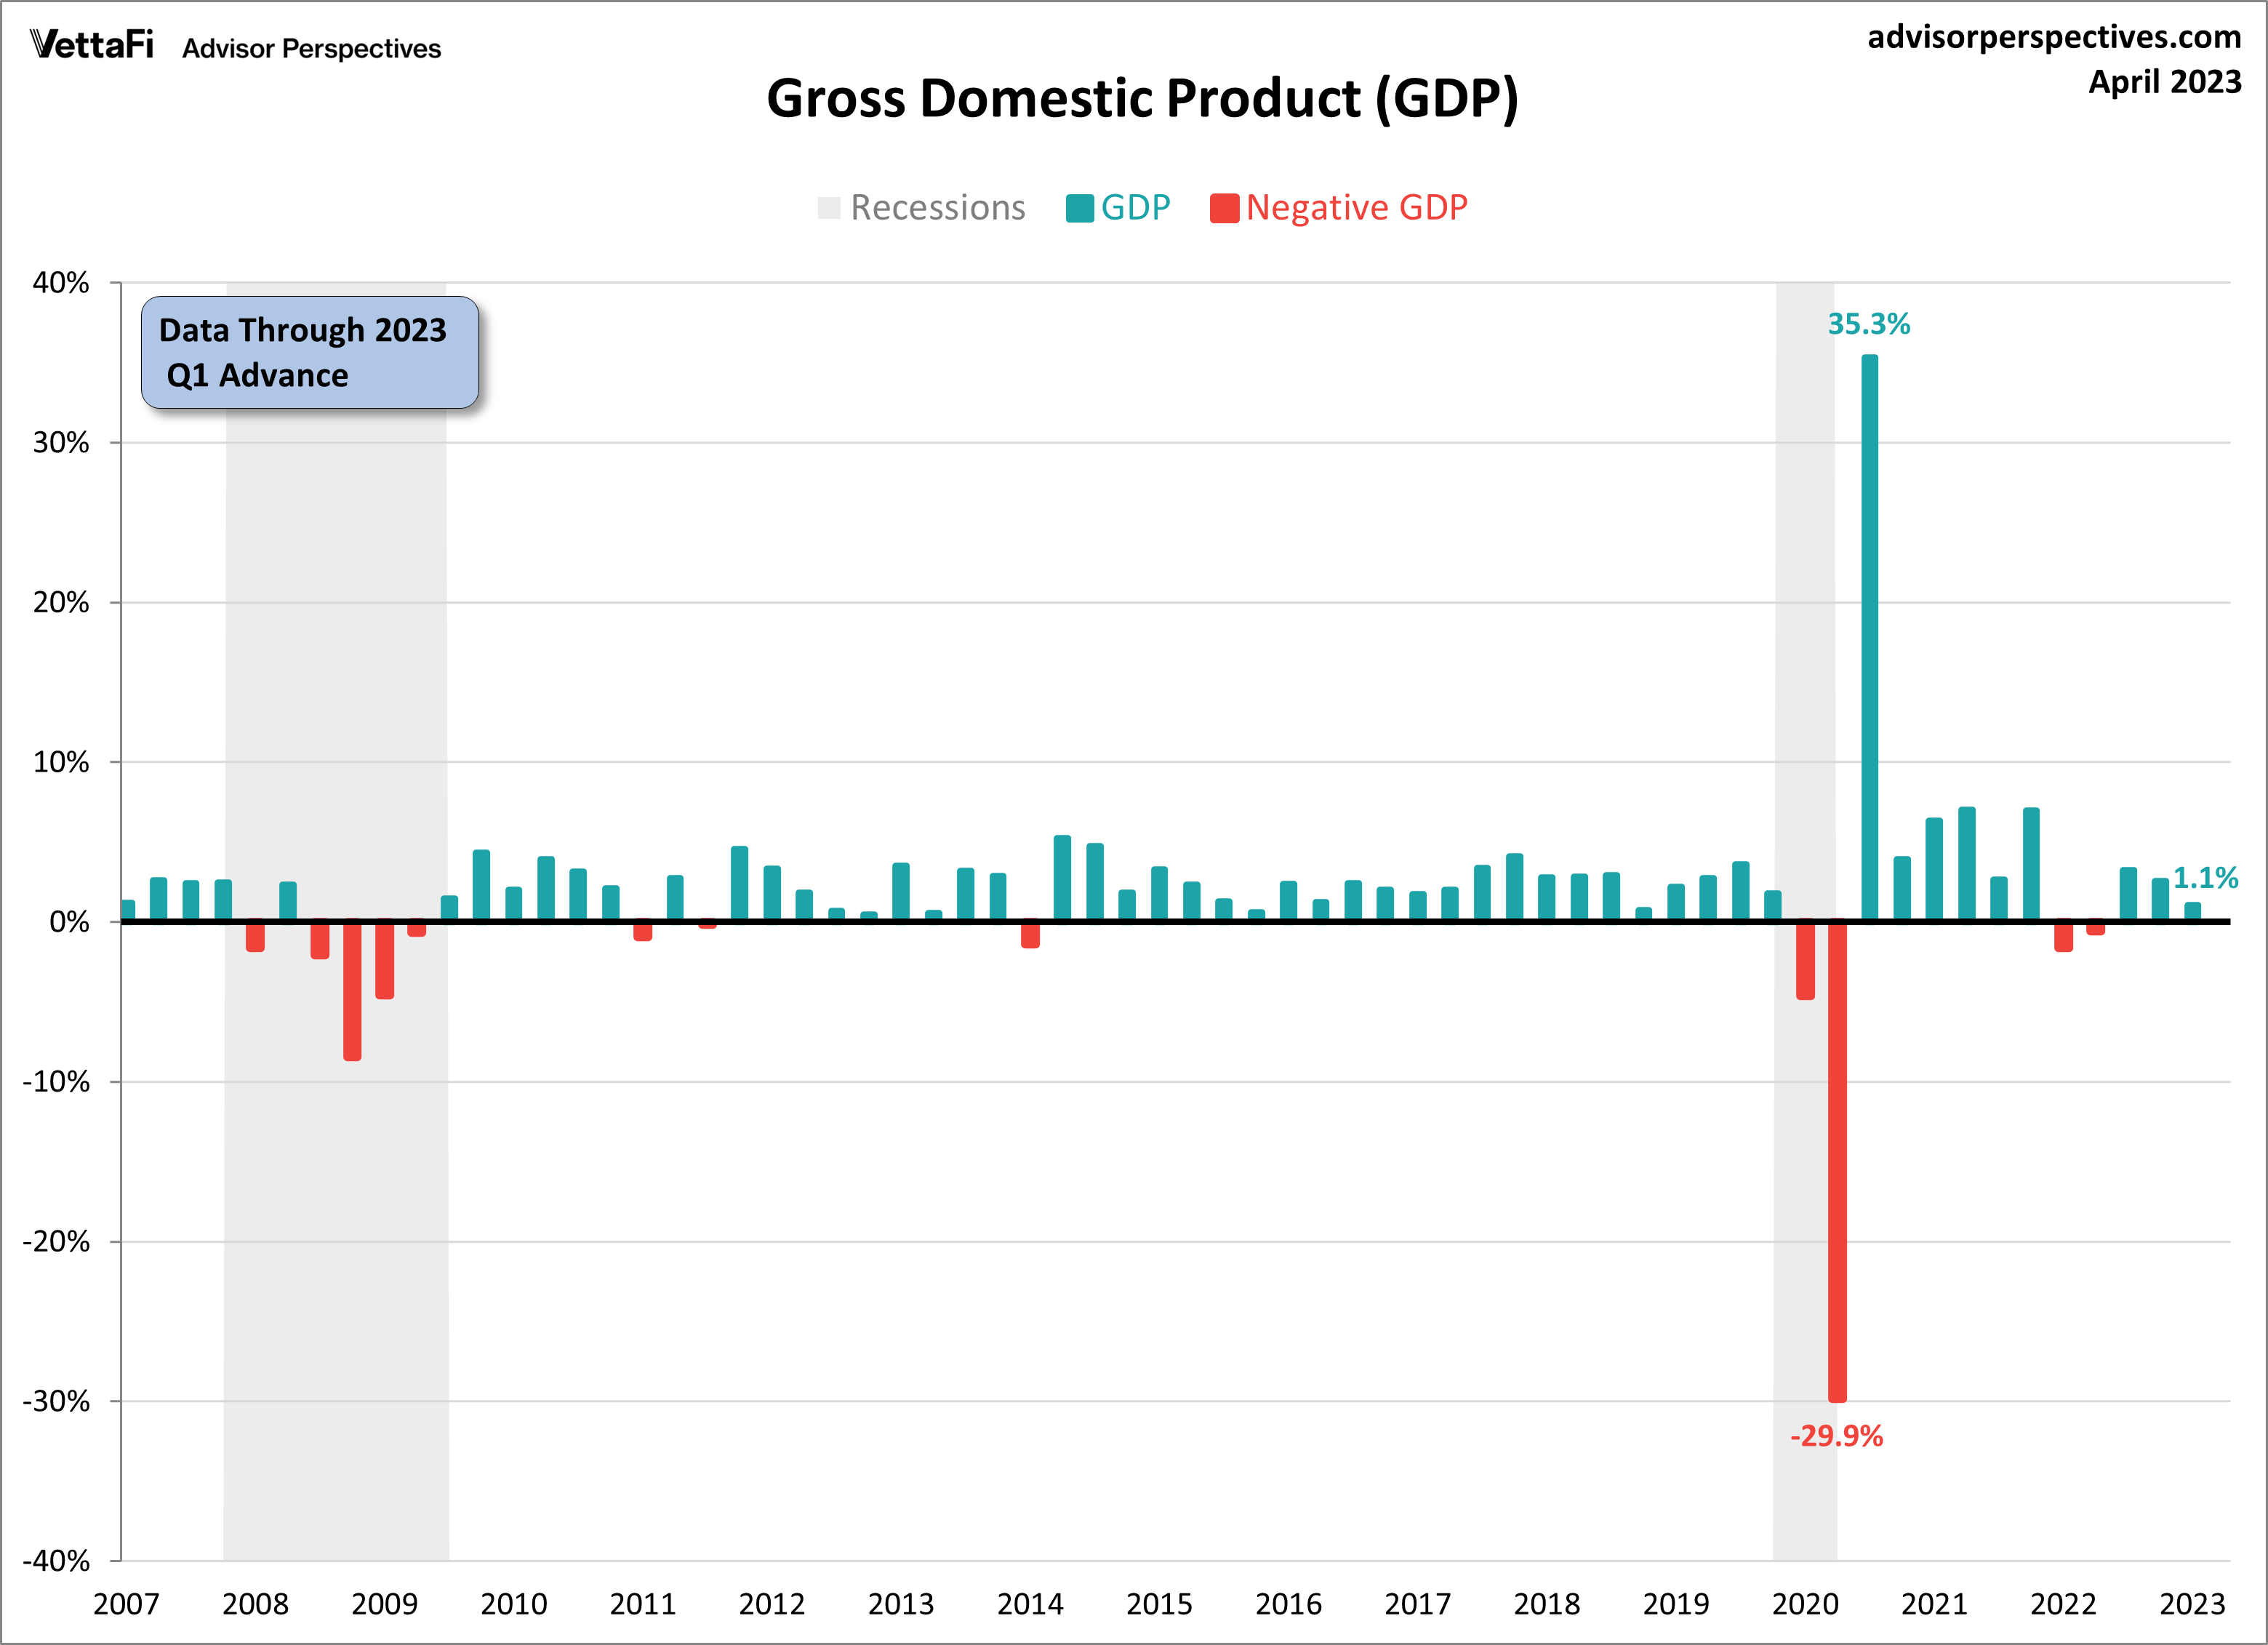
Gross Domestic Product (GDP)
The latest figures on real gross domestic product (GDP) show that the U.S. economy grew at a slower rate than anticipated at the beginning of this year. The advance estimate for Q1 2023 GDP showed the economy grew at a pace of 1.1%, slower than the predicted 2.0%. Despite the growth, the economy has been losing momentum over the past several months as the GDP has decelerated over the past two quarters, decreasing from 3.2% in Q3 of last year to 2.6% in Q4, and now down to 1.1%. Even though business spending experienced large declines during Q1, consumer spending started off strong and helped propel the overall growth in the first quarter. With that said, consumers have been pulling back each month since January as they fight against high inflation and rising interest rates, so it is likely that growth will continue to slow down in the coming months.
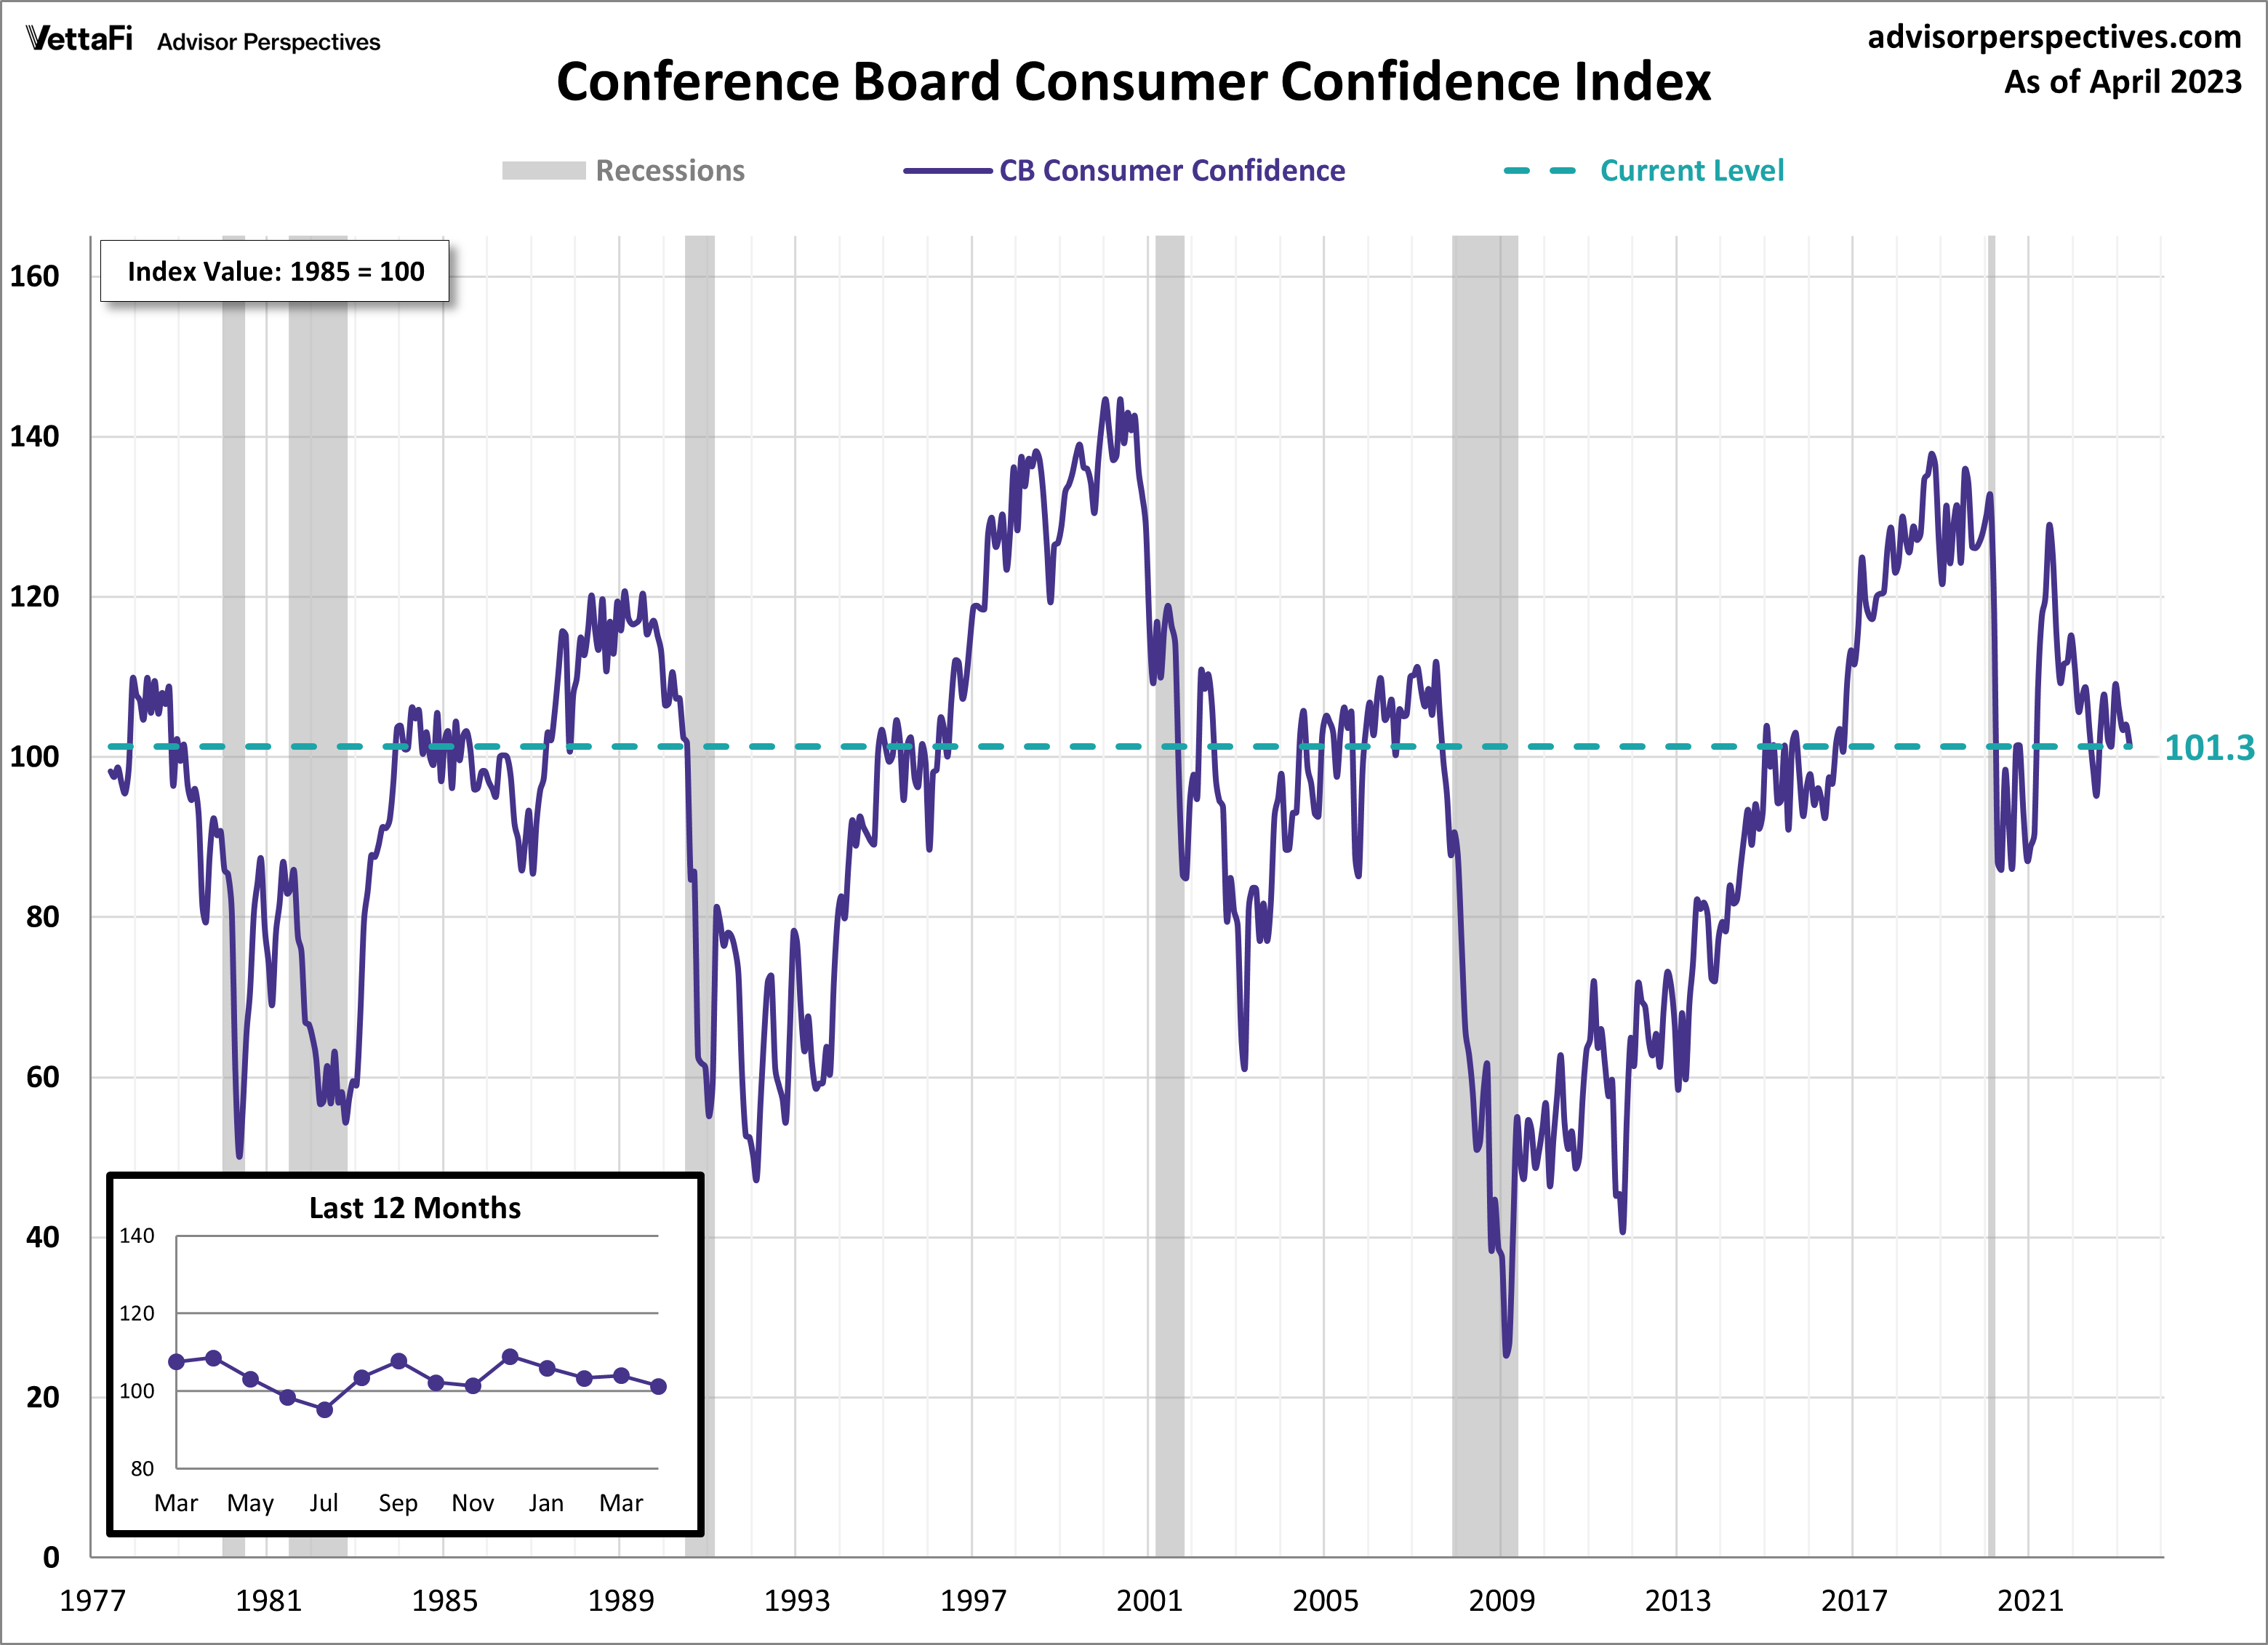
Consumer Confidence
The Conference Board Consumer Confidence Index® dropped this month to 101.3 from a downwardly revised 104.0 in March. The drop puts the index at its lowest reading in the last nine months and marks the third monthly decline in the last four months. The index is a monthly survey measuring consumer attitudes about current and future economic conditions. Consumers showed increased confidence levels in the present situation in April, however their outlook on future conditions deteriorated even further below the level the Conference Board associates with a recession beginning within the next year. The Consumer Discretionary Select Sector SPDR ETF (XLY) is tied to consumer confidence.
The focus for this week is on employment as the market awaits the release of several key reports. March’s JOLTs data and April’s BLS and ADP® employment reports will provide insights into the health of the labor market, and by extension, the overall economy. On Tuesday, we will learn if job openings continued their downward trend in March. The current forecast shows that job openings rose to 10.400 million from February’s 9.931 million, however job openings have declined for the past two months and have been in an overall decline for the last year. Then on Wednesday the ADP employment report will be released, which is forecasting an addition 150,000 nonfarm private employment jobs in April, following March’s 145,000 addition. Finally, on Friday, the BLS will release the eagerly awaited, more comprehensive employment report for April. Expectations are that 181,000 nonfarm jobs were added in April, down from 236,000 in March, and that the unemployment rate rose from 3.5% to 3.6%.
For more news, information, and analysis, visit the Portfolio Strategies Channel.