
Several key economic indicators are released every week offering valuable insights into the overall health of the U.S. economy. Policymakers and advisors closely monitor economic indicators to understand recession risk and the direction of interest rates because the data can ultimately impact business decisions and financial markets. In the week ending on August 24th , the SPDR S&P 500 ETF Trust (SPY) rose 0.14% while the Invesco S&P 500® Equal Weight ETF (RSP) was down 0.37%.
Analyzing a variety of economic indicators allows us to uncover different facets of economic activity, contributing to a more comprehensive understanding of the broader economic landscape. For instance, the Michigan Consumer Sentiment Index from last week shed light on consumer sentiment towards the economy, while the latest data on existing and new home sales offered fresh insights into current housing market trends. In this article, we take a deeper look at each of these three indicators.
Consumer Sentiment
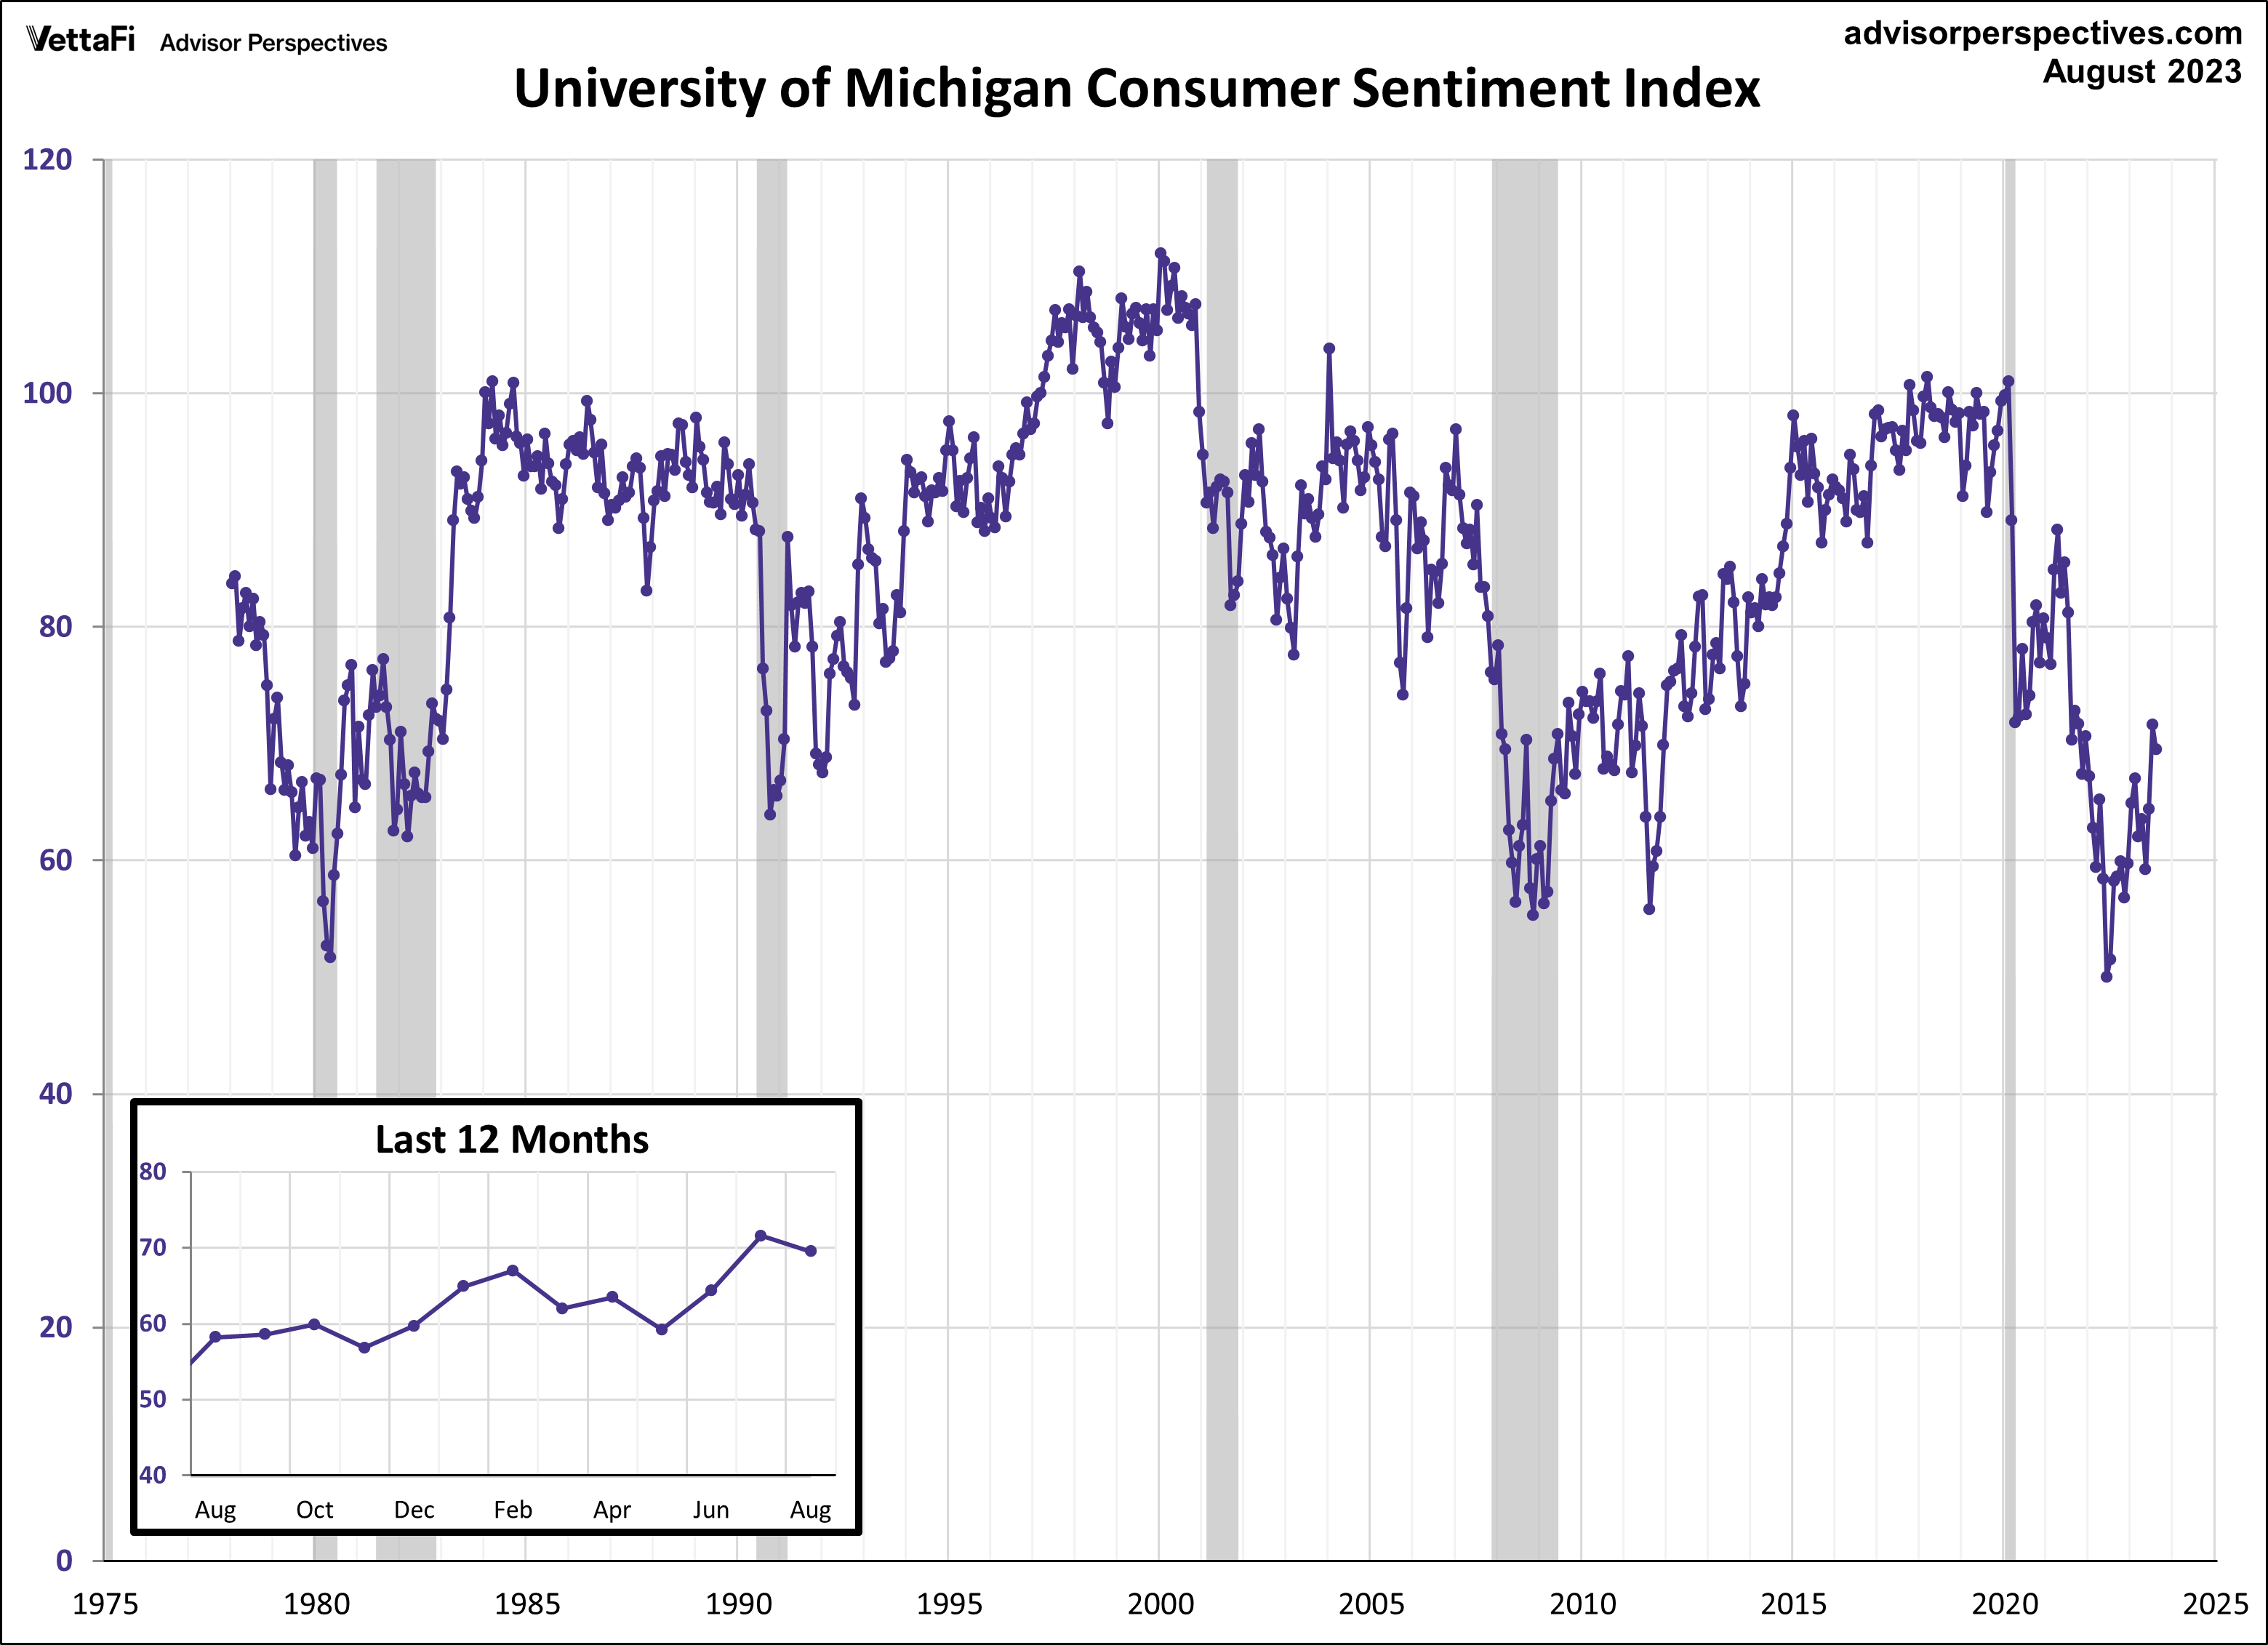
Consumer sentiment experienced a slight dip this month, driven by growing consumer uncertainty regrading the future outlook of the economy. According to the final August report of the Michigan Consumer Sentiment Index, the index recorded a reading of 69.5. This marks a 2.9% decrease from July’s final reading and falls short of the forecast value of 71.2. Despite the decline, the latest reading is the index’s second highest reading in 20 months, with only July holding a higher position.
The Michigan Consumer Sentiment Index is a monthly survey measuring consumers’ opinions with regards to the economy, personal finances, business conditions, and buying conditions. In the latest report, buying conditions and living conditions expectations improved, but the long-run economic outlook deteriorated. Inflation expectations remain high, and consumers feel that recent improvements in inflation and the economy have moderated. Consequently, consumers are uncertain about the future, as evidenced by a 4.1% decline in future expectations, which largely contributed to this month’s minor drop in consumer sentiment.
The Consumer Discretionary Select Sector SPDR ETF (XLY) is tied to consumer sentiment.
Existing Home Sales
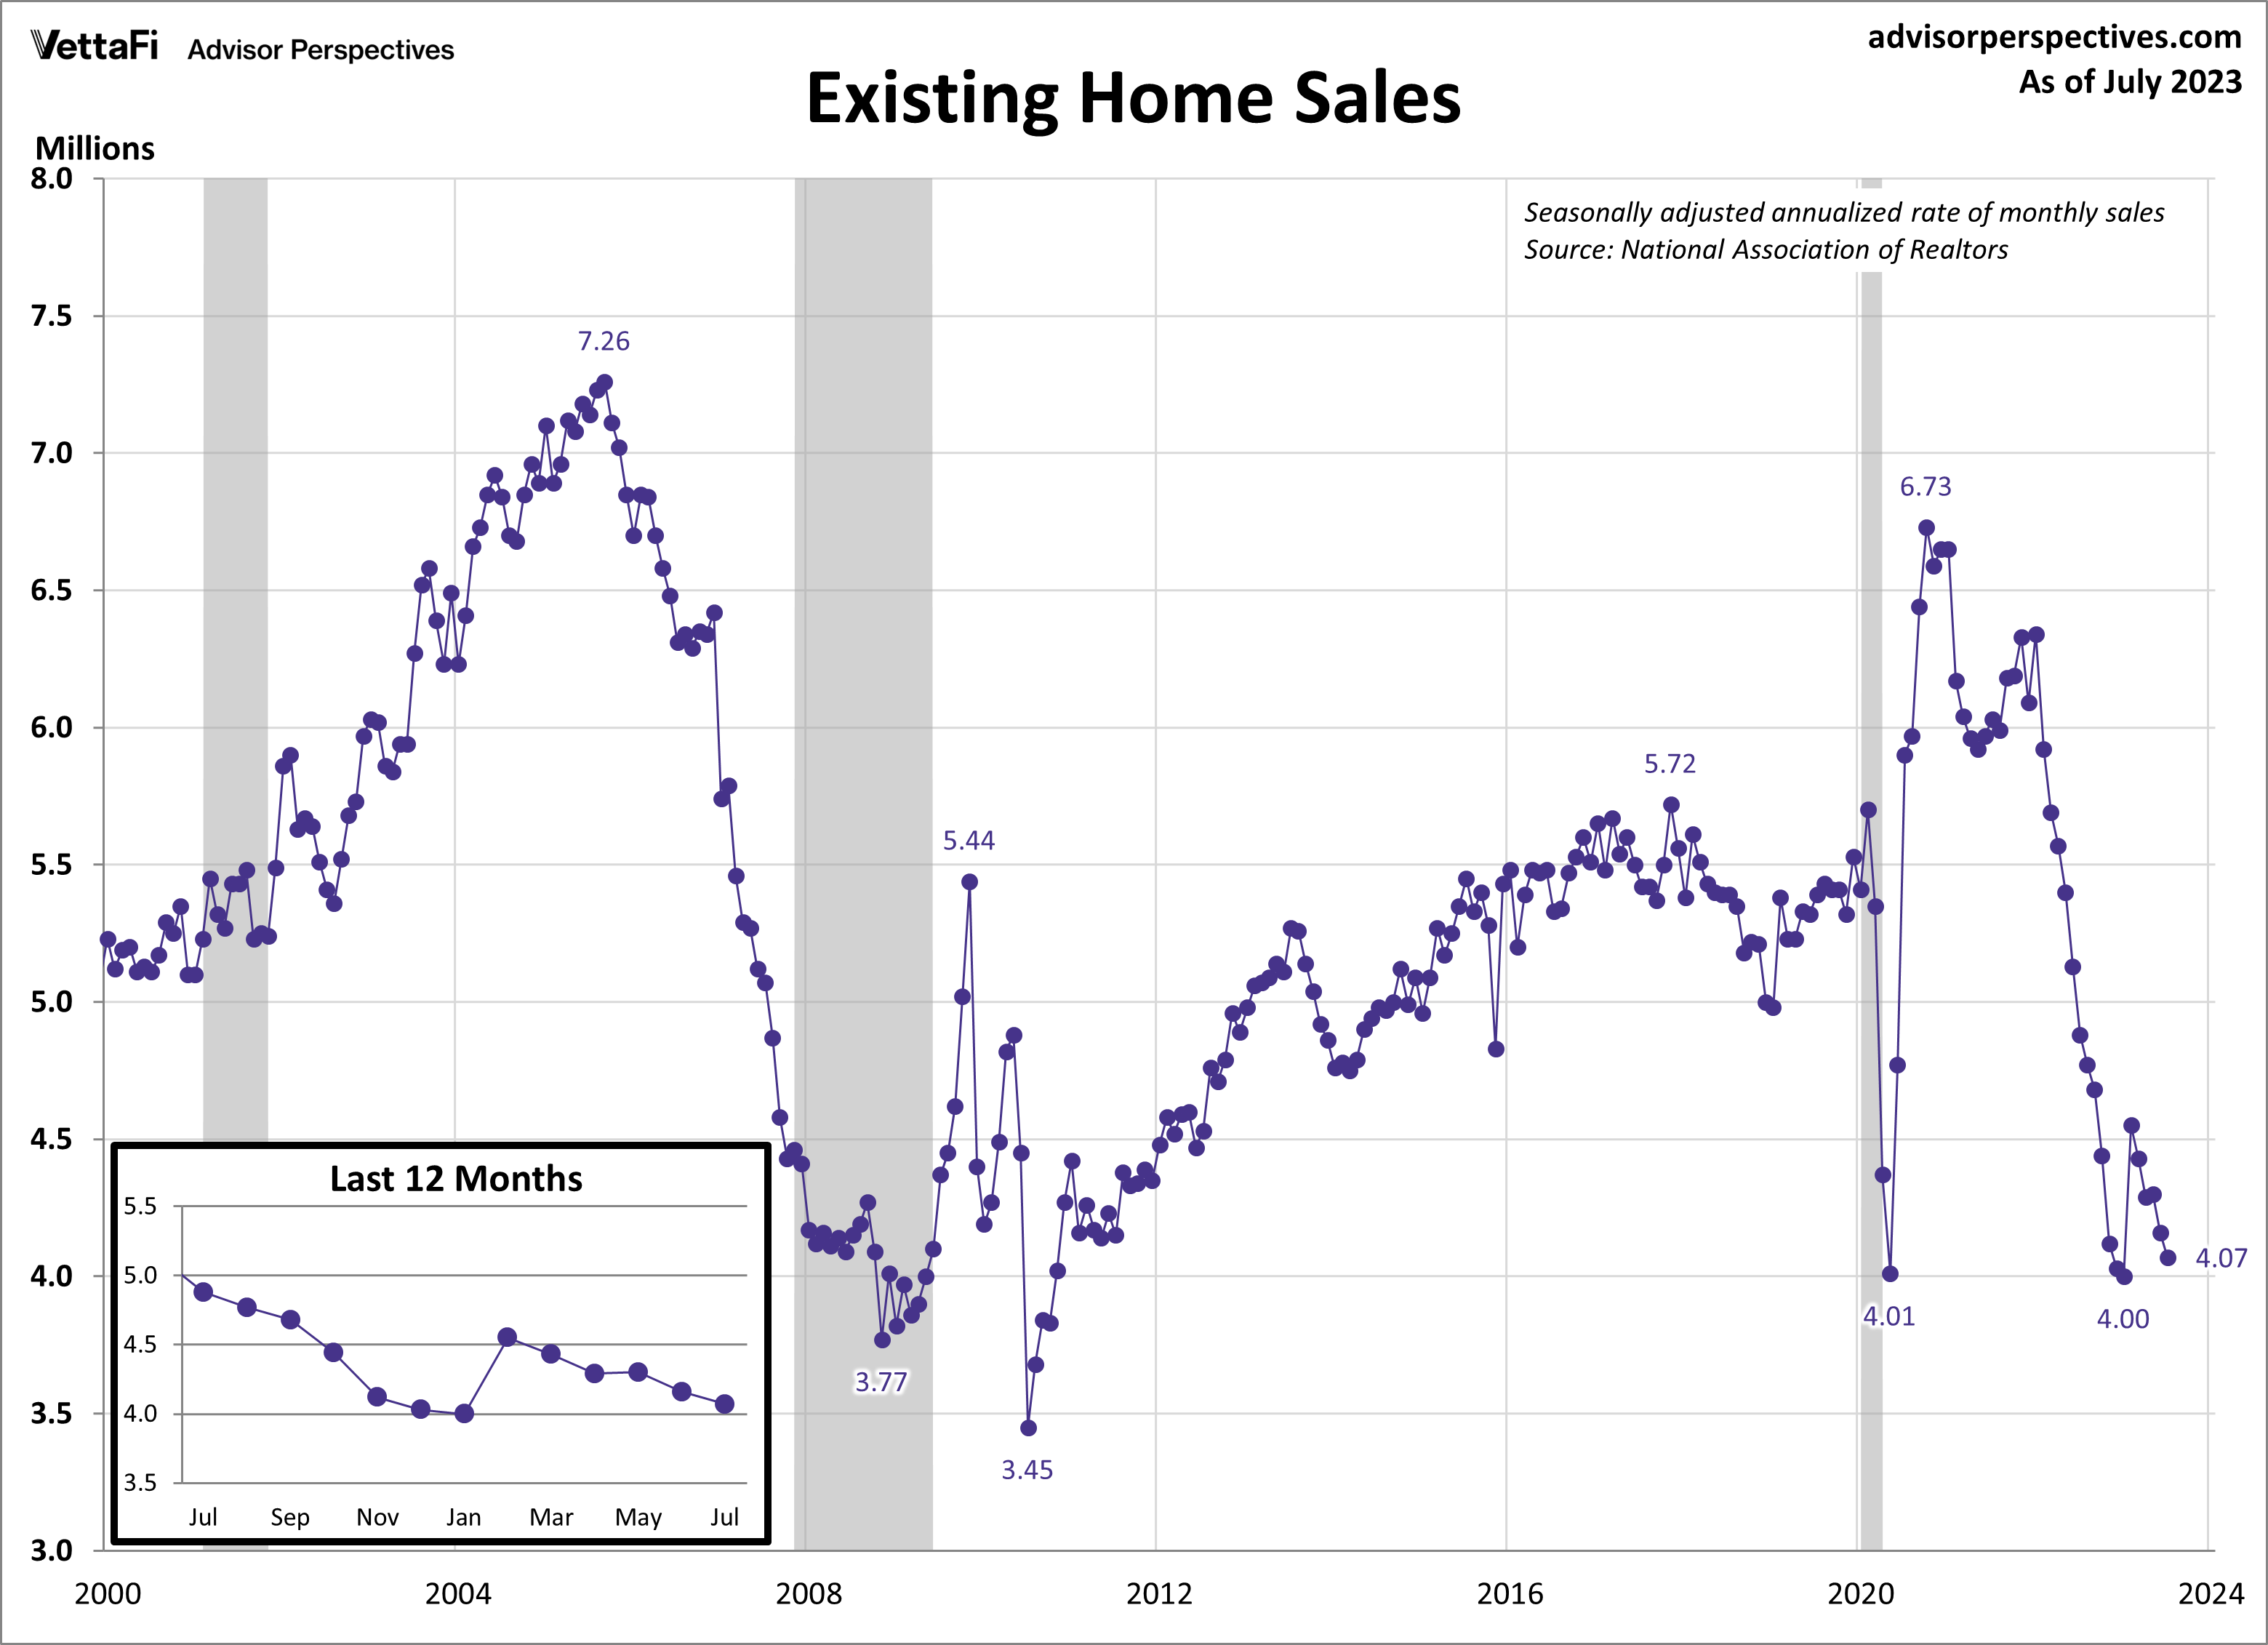
Existing home sales have continued their downward trend due to persistently limited inventory and soaring mortgage rates. In July, existing home sales fell by 2.2%, reaching a seasonally adjusted annual rate of 4.07 million units. This decline marks the 16th drop in the past 18 months, highlighting the consistent downward trajectory in existing home sales over the last year and a half. The latest figure was lower than expected, with sales falling short of the projected 4.15 million units.
Existing home prices remained elevated in July which can largely be attributed to the near two-decade high in mortgage rates. The median price for existing homes saw its first drop in six months, reaching $406,700. Despite the minor dip, the latest figure marks only the fourth time on record that median prices have exceeded the $400,000 mark. Many current homeowners are holding onto their homes, benefiting from lower mortgage rates they secured years ago and are reluctant to sell due to the prospect of higher mortgage rates. Consequently, the inventory of existing homes remains limited. Over the past several months, this reluctance to sell, coupled with strong demand, has intensified competition among homebuyers and led to subsequent price increases.
Existing home sales could impact residential real-estate ETFs such as the iShares Residential and Multisector Real Estate ETF (REZ).
New Home Sales
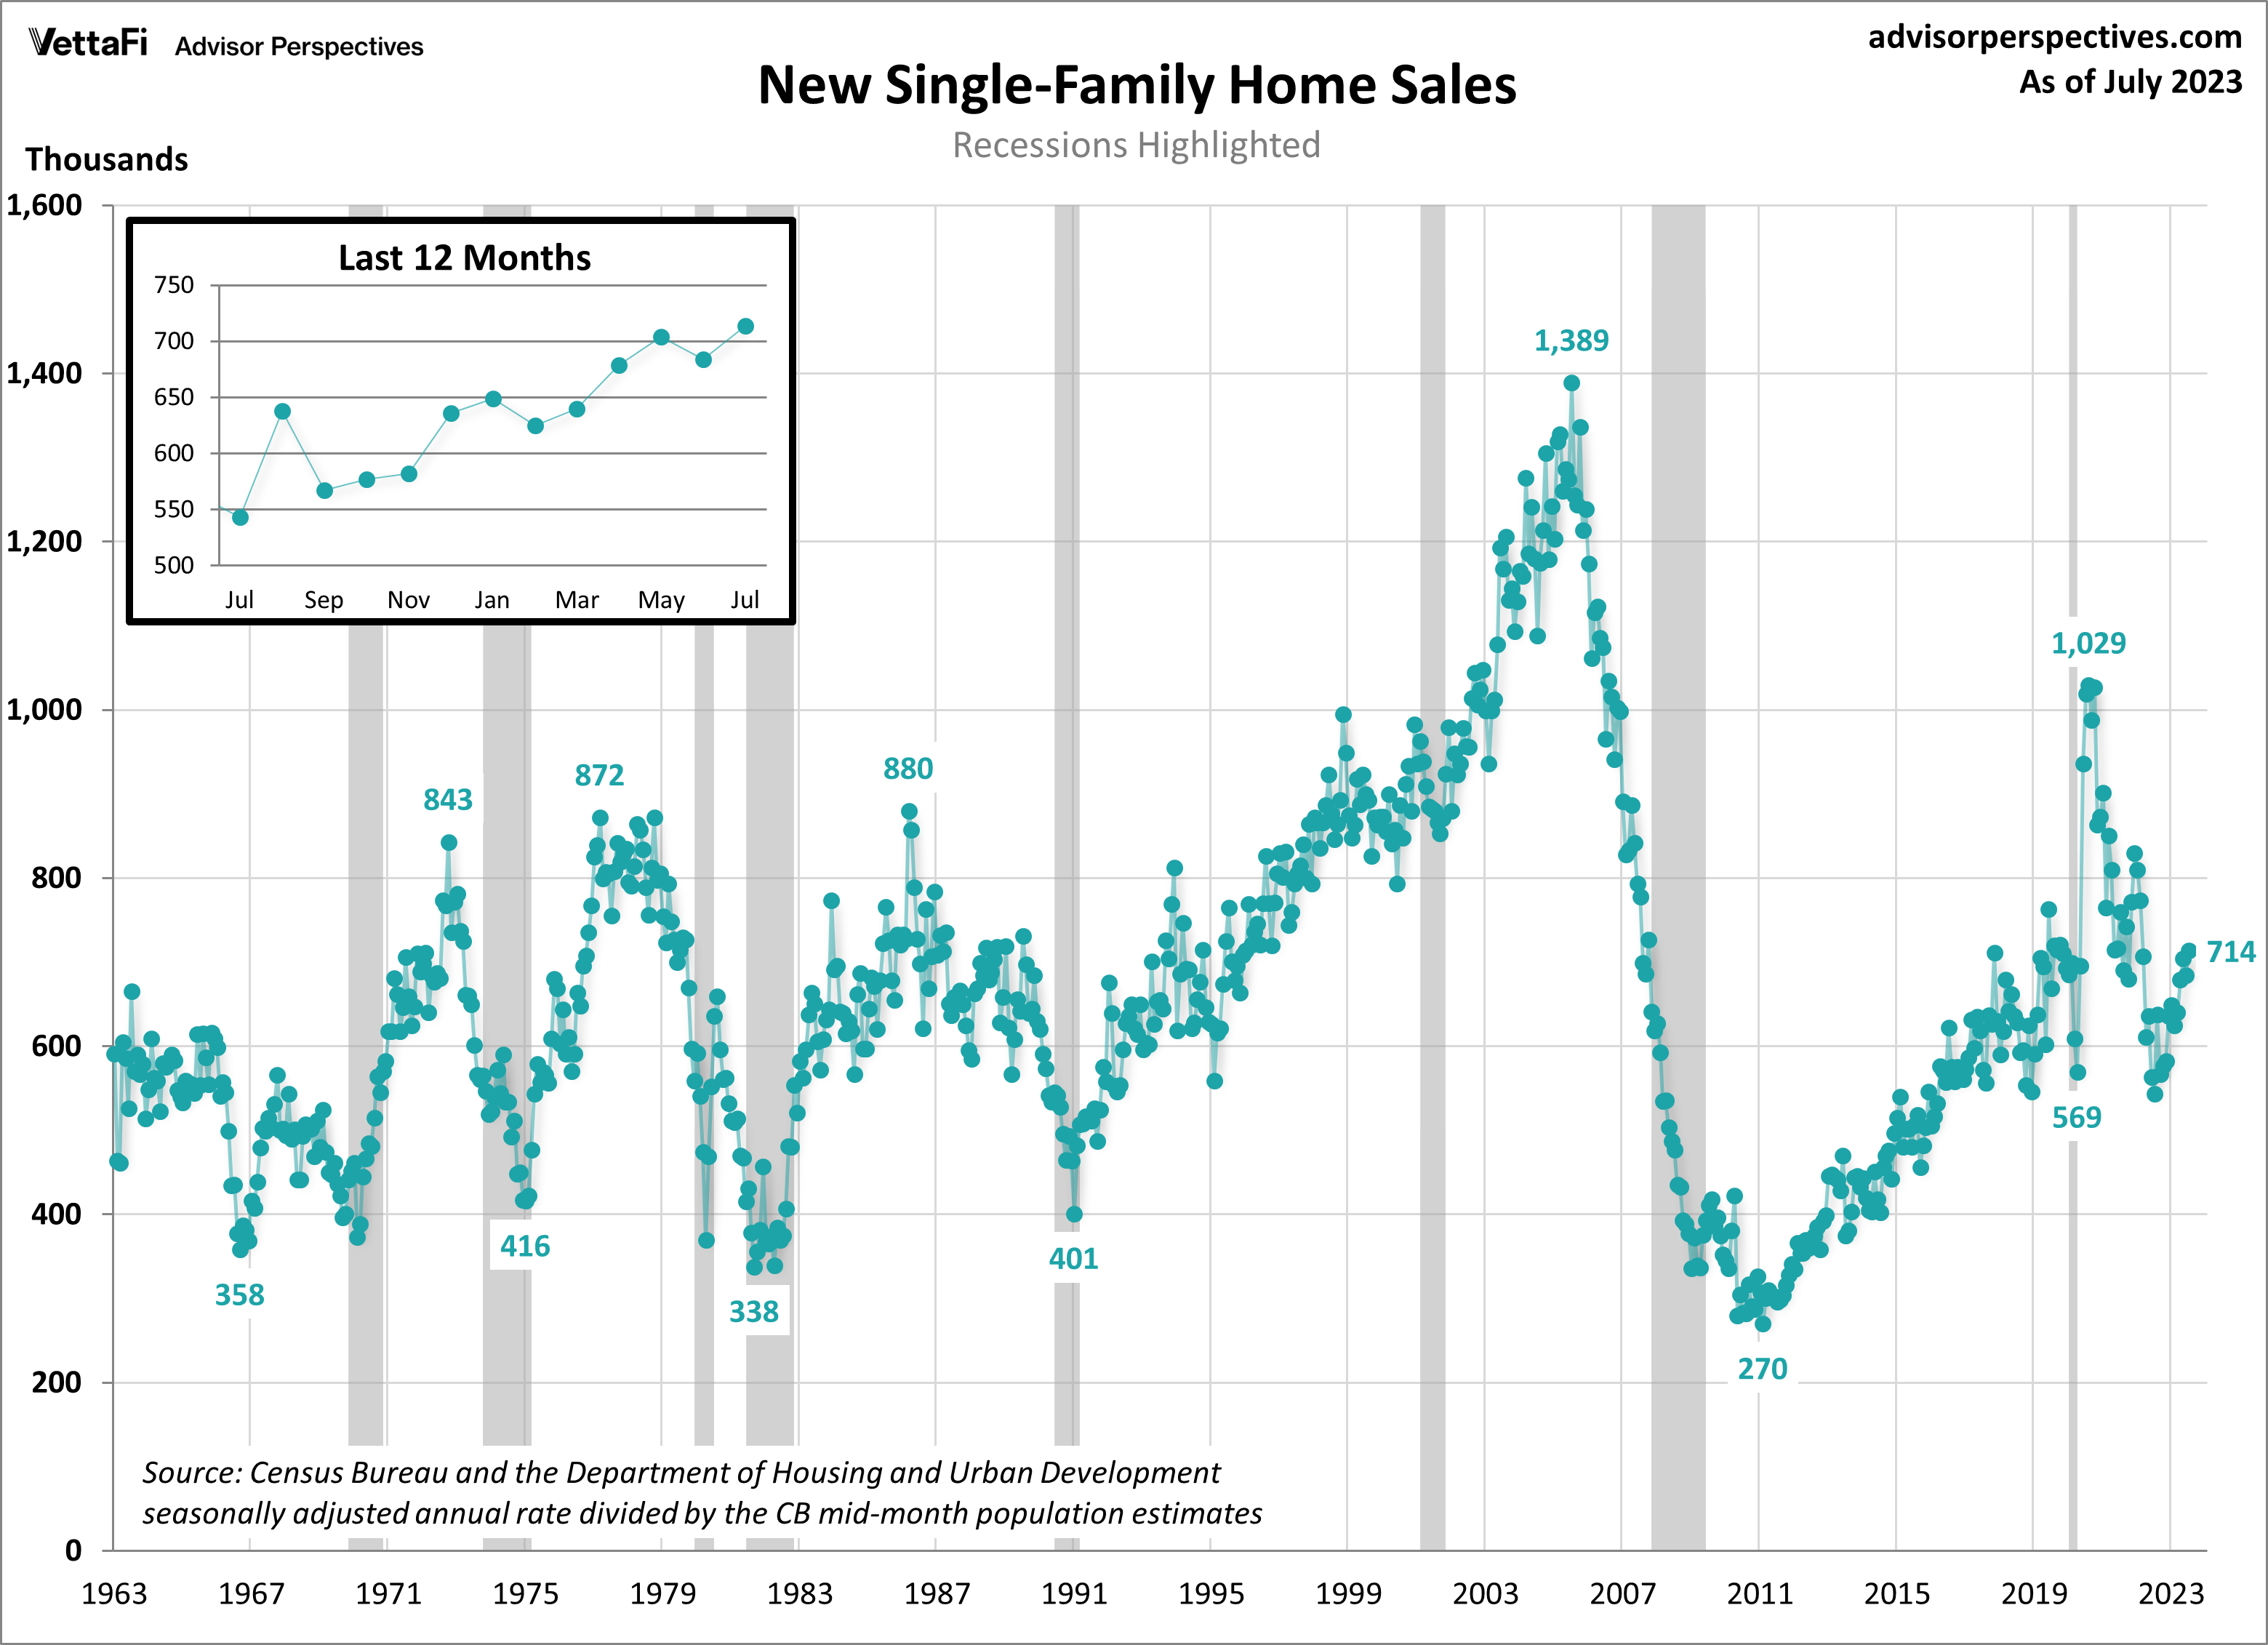
New home sales continue to grow as options for homebuyers remain limited. In July, new home sales surged by 4.4% to a seasonally adjusted annual rate of 714,000 units, surpassing the anticipated rate of 705,000 units. Over the past year, homebuyers have increasingly turned to new construction as elevated mortgage rates have restricted options in the existing home market. New home sales have grown 8 of the past 10 months, currently sitting at their highest level since February 2022. Notably, July’s sales are a remarkable 31.5% higher than they were a year ago. The latest report also revealed that the median price for a new home rose to $436,700 in July, a 4.8% increase from the previous month but an 8.7% decline from July of last year.
New home sales could impact homebuilders ETFs such as iShares U.S. Home Construction ETF (ITB), SPDR S&P Homebuilders ETF (XHB) , Invesco Dynamic Building & Construction ETF (PKB), and Direxion Daily Homebuilders & Supplies Bull 3X Shares (NAIL).
Economic Indicators and the Week Ahead
The upcoming week will be packed with data with the release of some of the biggest economic indicators, including the 2023 Q2 GDP second estimate, July’s PCE index data, and August’s employment report. The data will provide insights into the state of the country’s economy by revealing the latest economic growth and labor market trends. On Wednesday, the 2023 Q2 second estimate is forecasted to come in at 2.4%, unchanged from the Q2 advance estimate of 2.4% and up from the 2023 Q1 final estimate of 2.0%. The core PCE price index, the Fed’s preferred measure of inflation, will be released on Thursday where we’ll learn if inflation continued to cool for a third consecutive month or if it moved further away from the Fed’s 2% target. Finally on Friday, the BLS’s employment report will be released with expectations that the unemployment rate will remain within the historically low range of 3.4% to 3.7%.
For more news, information, and analysis, visit the Portfoliio Strategies Channel.
