Related: Top 34 Oil ETFs
Charts: Bad News
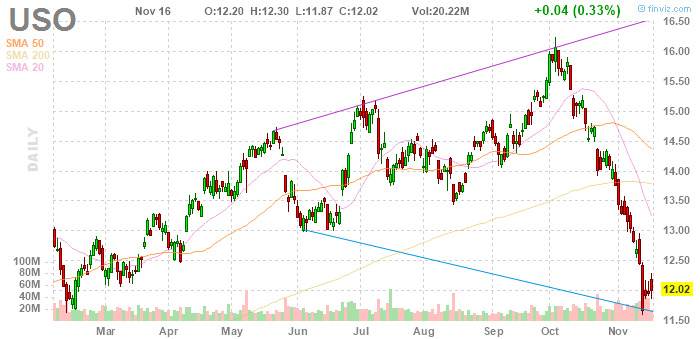
“On Wednesday, WTI snapped its longest losing streak ever, down 12 days in a row. Due to the severity of the oil decline, Yamada isn’t eliminating the chance of a near-term bounce to the $59 to $60 a barrel. However, she’s convinced there’s a low probability it’ll stick, referring to how crude has traded since its all-time high of $145 a barrel hit back in July 2008,” according to CNBC.
Oil analysts point to a combination of higher-than-expected output from key producers and a gloomy outlook for oil demand. The decline in prices is an about-face from last month’s rally that saw oil hit four-year highs based on the assumption that supply would be crimped due to reduced output from Iran as a result of the U.S. leveling sanctions.
For more information on the energy sector, visit our energy category.
