Thought to ponder…
“Because of the spirit, I say. Because of the heart. Writing and reading decrease our sense of isolation. They deepen and widen and expand our sense of life: they feed the soul.”
– Anne Lamott, Bird by Bird
The View from 30,000 feet
Thursday marked the final trading day of the week, month and quarter. It seemed only fitting the two major data releases on Thursday delivered the overarching message of 2024 – better than expected growth, mixed with a downshift in the disinflationary trends of last year. On Thursday, Q4 2023 GDP was revised higher and Q4 2023 GDI was released, showing a catch up between GDI and GDP, that squashed the dreams of many a bear. Earlier in the week the Atlanta Fed GDPNow was also revised higher, now projecting Q1 2024 grew at a 2.3% annualized rate. Strategists have been scrambling all quarter to upgrade their GDP and equity market forecasts for 2024, but still look behind the ball, as the both the economy and the equity markets continue to surprise on the upside.
Thursday’s PCE release was inline with expectations showing that the disinflationary trends related to Goods disinflation in 2023 are running out of steam, and it will now be up to housing, wages and the service sector to finish the disinflationary story in the coming year. Last week’s message from the Fed highlighted two camps that are forming within the Fed – The Powell Camp and The Waller Camp. Powell, restated his case last week that he believes the disinflationary trends will persist, although along a bumpy path. Waller, showed another side of the Fed, one that is concerned that disinflationary trends will stall in the coming year. What this means for interest rates this year is the difference between three rate cuts, or as few as zero rate cuts. What this means for equities, however, may be subtle. Either way growth wins, either by virtue of being goosed by lower rates, or by being driven by spending.
Although the path for the remainder of the year will not be linear, there are few negative catalysts showing their faces.
- PCE release highlighted the disinflationary handoff that needs to happen between goods and services
- Preview of Q1 2024 earnings season: Growth still expecting to being led by Comm Services and Tech
- The Focus Point Leading Market Indicator ticks slightly higher at month end driven by loosening financial conditions
- The most Frequently Asked Question from clients this week: Do higher interest rates matter to the economy?
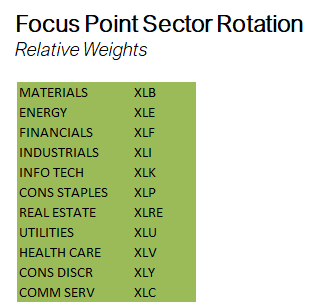
- Focus Point Sector Rotation Update: Extreme momentum signal indicates a slow grind higher could continue
PCE highlighted the disinflationary handoff that needs to happen between goods and services
- The headline month-over-month PCE printed 3%, which came in slightly below the consensus estimate of 0.4%. While the year- over-year headline and core PCE printed inline with consensus estimates, at 2.5% and 2.8%, respectively. The year-over-year numbers did not dip below the estimate because the prior month was revised higher. The net was, everything was pretty much inline with estimates, which does little to motivate the Fed to move.
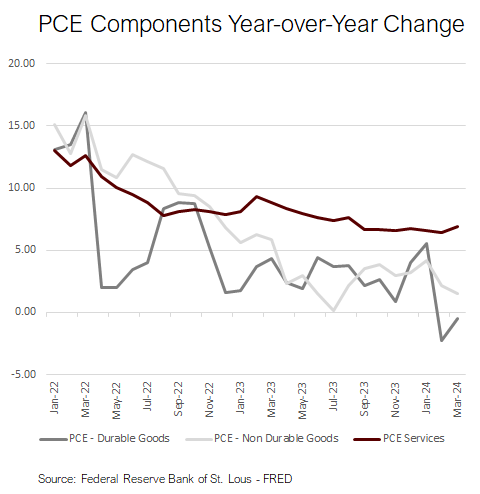
- The bigger pictures is represented on the chart to the right, which represent the annual change in the three largest components of PCE, Durable Goods (furnishings, motor vehicles, recreational goods…), Non-Durable Goods (clothing, food and beverages, gasoline..) and Services. Key in this chart is that Services have not budged since last fall, the sole story is about goods. Durable goods have actually been experiencing deflation. For the PCE story to continue to unfold in a favorable direction to support rate cuts, services must join the disinflationary bandwagon. However, note Services are actually moving higher at the moment.
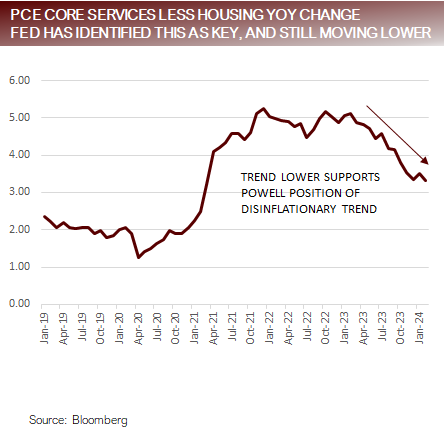
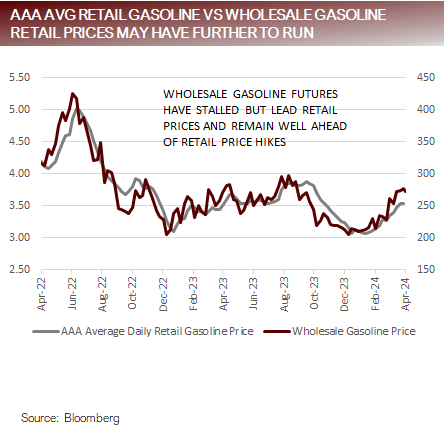
PCE Core Service Less Housing still supports a friendly Fed; gasoline has wildcard potential
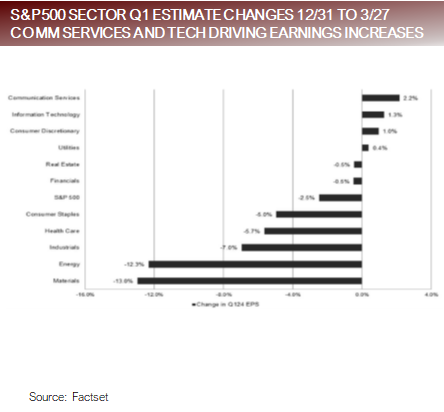
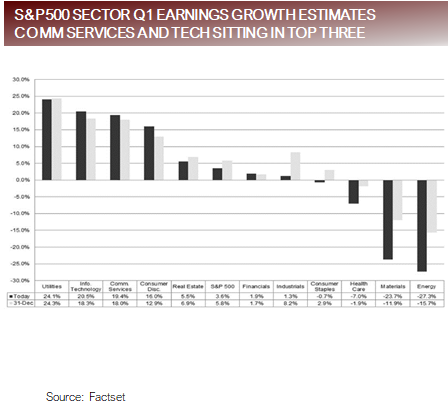
Preview of Q1 2024 earnings season: Still expecting to being led by Comm Services and Tech
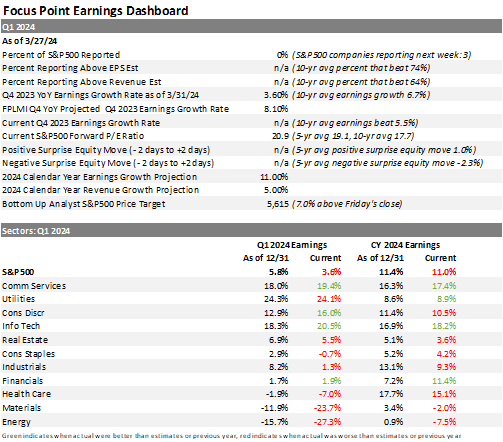
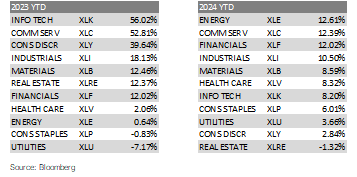
- Comm Services, Info Tech and Financials are the only three sectors that earnings estimates have been trending up for both Q1 and for the entire calendar The respective gains of each of these sectors for the year is 12.39%, 8.20% and 12.02%, making Comm Services and Financials in the top three performing sectors. The message is that performance is following earnings growth and upward revisions.
- At the end of 2023, analysts bottom-up S&P500 forecast was 407 points As of Friday, the bottom-up S&P500 forecast is 495 points higher. This indicates that analysts’ projections aren’t just increasing, they are getting more bullish by raising their estimates higher as a percentage of the companies share price.
- There has been a lot of chatter by strategists since the beginning of the year that 11% earnings growth for 2024 is undoable, yet here we are a quarter of the way into the year and the estimates have barely budged.
The rally has broadened out (which is fantastic) but earnings growth still concentrated Comm and Tech
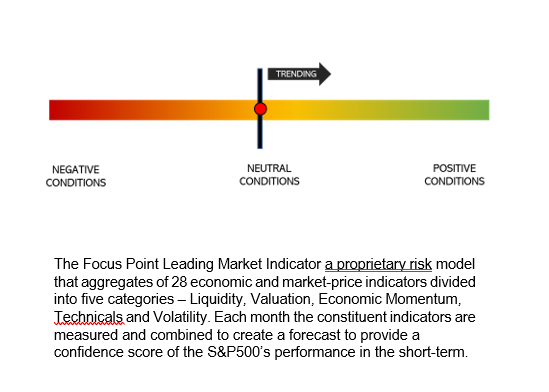
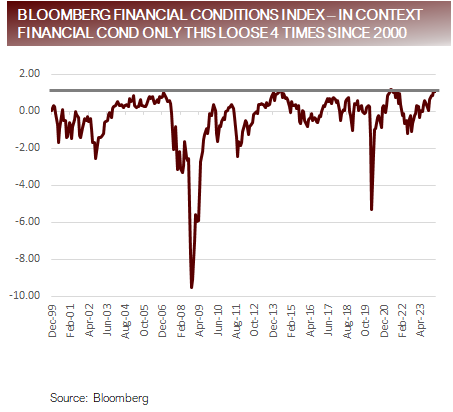
The Focus Point Leading Market Indicator ticks slightly higher driven by loosening financial conditions
- The Focus Point Leading Market Indicator (FPLMI) remained in Neutral Conditions as the end of March but nudged slightly higher driven by loosening financial conditions.
- There continues to be a dispersion between hard data (actual output data) and soft data (survey data), with the hard data measuring stronger than the soft data.
- The combination of weak soft data and an inverted yield curve continues to vex traditional models trained only in large historical samples, where more adaptive models, such as the FPLMI, have been able to pick up the anomaly of the soft data flaw in the current cycle.
- A concrete example of this phenomena is the Conference Board Leading Economic Indicators, which finally turned positive last month, after indicating a recession the last two years, with the only remaining negative pointing constituents composed of soft data and the yield curve.
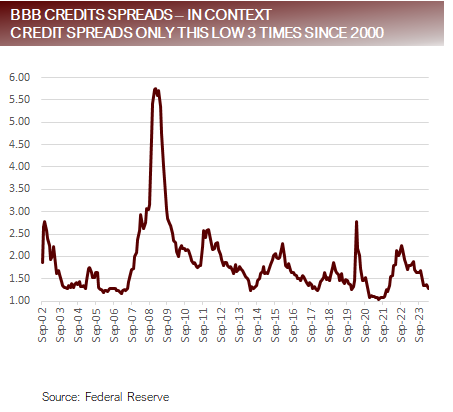
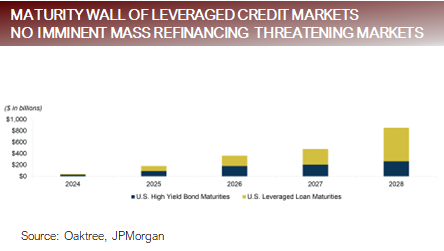
Strains in corporate Balance Sheets and market liquidity are not visible in recent data
FAQ: Do higher interest rates matter to the economy?
- Between March 16, 2022, and July 26, 2023, the Federal Reserve raised interest rates from 25% to 5.50%. The short answer is yes in some places, but no in others.
- There are a couple ways to answer this The first is to address how different sectors of the economy performed, and the second is address the why.
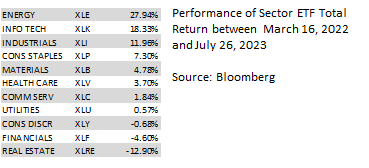
- Performance alone doesn’t tell the whole story because there were a lot of additional factors at play other than the Fed, such as the AI chase trade and the impact to energy prices related to Russia’s attack on Ukraine, but interest rate sensitive sectors such as Real Estate, Financials and Utilities showed have shown significant signs of strain as a result of higher rates.
- Perhaps more interesting is why the economy and financial markets performed differently than might have been expected, which provides us some insights about the factors that having been influencing resistance to higher Factors providing resistance include:
- Corporations and individuals terming out their debt at the ultra low rates immediately following the pandemic.
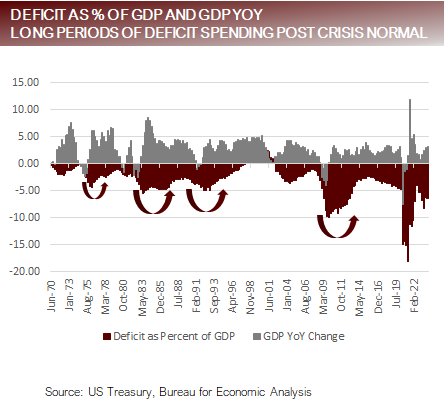
- Buffers put in place from the fiscal side which included government transfer payments to individuals during the pandemic and deficit spending programs that have continued despite economic strength
- Quick response by the Fed at any signs of a liquidity problem (Silicon Valley Bank)
Terming out debt and deficit spending have been big contributors to easing impact of rates
Focus Point Sector Rotation Update: Extreme momentum signal indicates a slow grind higher
- The Focus Point Sector Rotation Model is a combined trend following and mean reversion model that utilizes seven factors to analyze daily price data on sectors to determine the strength of upward trends.
- We started running the sector model out of sample January 1, 2024, prior to that period the analysis was based on a back test. During the back test period, all eleven sectors were up in unison, as they are today, less than 1% of the time. In these instances, the markets were generally relatively weak for the first week after the synchronized up trend signal, but then progressively stronger over the next four weeks.

Putting it all together
- Looking at equity index performance over the first three months of 2024, it looks a lot like a continuation of the trends of 2023. However, looking underneath the surface there have been a lot of changes.
- Ten out of eleven sectors are up on the year, with S&P500 up 10.55%. The average sector is up 7.62%, and the median sector is up 8.32%. To give this some perspective against last year, the median sector last year was about 6% lower than the average, suggesting that performance was driven by a chosen few at the top last year, while much more evenly distributed this year. The same trends, though not detailed here, are true across market caps and international geographies.
- In addition to the broadening out story, the other trends impacting markets this year have included:
- Continued consumer spending supporting corporate profits, despite signs that the labor markets are softening.
- A reawakening of global manufacturing survey data, possibly signaling a transition away from recessionary mindsets.
- Stagnant disinflationary trends calling into question, if and when, inflation will return to the Fed’s target inflation rate.
- A rift appearing within the Fed with one side believing in the disinflationary trends of yesteryear, and the other side skeptical that the disinflationary trends will persist. Net these together and we have a lower expectation for rate cuts.
For more news, information, and analysis, visit VettaFi | ETF Trends.
