

Investors frequently turn to rules-based exchange traded funds to limit downside risks and while still maintaining upside potential.
Trend-following can be a tricky strategy for many investors to employ on their own. Fortunately, several exchange traded funds ease that burden.
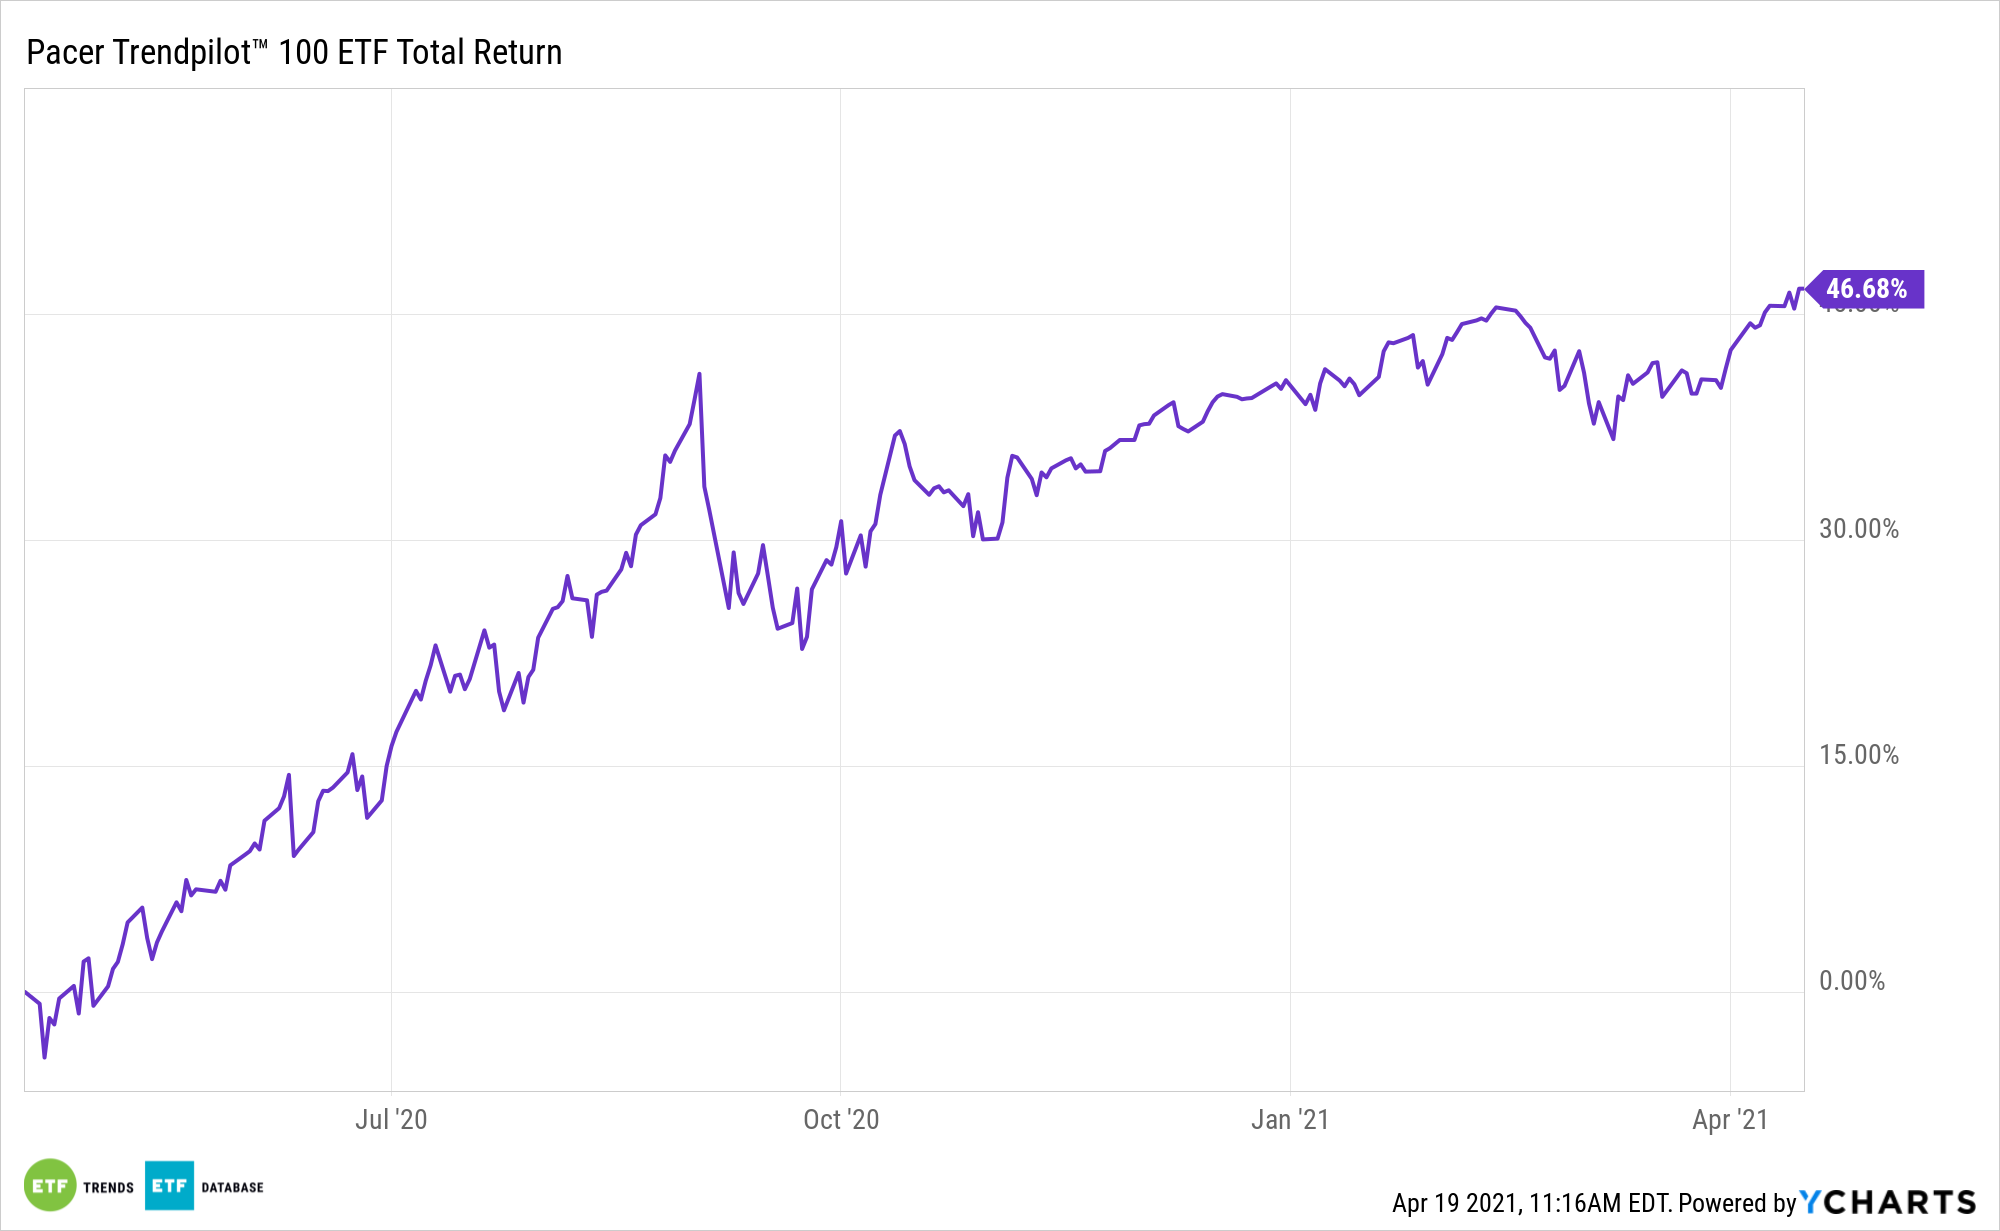
That group includes the Pacer Trendpilot 100 ETF (CBOE: PTNQ). PTNQ seeks to track the total return performance of the Pacer NASDAQ-100 Trendpilot Index. The index implements a systematic trend-following strategy that directs exposure (i) 100% to the NASDAQ-100, (ii) 50% to the NASDAQ-100 and 50% to 3 Month U.S. Treasury bills, or (iii) 100% to 3-Month U.S. Treasury bills, depending on the relative performance of the NASDAQ-100 TR and its 200-business day historical simple moving average.
PTNQ follows strict guideline with three indicators, including an equity indicator, a 50/50 indicator, and a T-bill indicator.
The NASDAQ-100 Trendpilot Index’s Methodology
A trend-following strategy could diminish drawdowns during bearish market conditions to help improve overall, long-term investment returns. The Pacer Trendpilot strategy basically tries to participate in the market when it is trending up, pare back market exposure during the short-term market downtrends, and prevent extended declines by moving to T-bills during long-term market downtrends.
The Equity Indicator refers to when the Benchmark Total Return Index closes above its 200-day SMA for five consecutive business days, at which the exposure will be 100% to the Benchmark Index. From the equity position, the Index will change to the 50/50 position or the T-Bill position depending on the 50/50 Indicator and the T-Bill Indicator.
The Price Signal 50/50 Indicator refers to when the Benchmark Total Return Index closes below its 200-day SMA for five consecutive business days, during which the exposure will be 50% to the Benchmark Index and 50% to 3-Month US Treasury bills. From the 50/50 position, the Trendpilot Index will return to the equity position or change to the T-Bill position depending on the Equity Indicator or T-Bill Indicator.
Lastly, the Trend Signal T-Bill Indicator refers to when the Benchmark Total Return Index’s 200-day SMA closes lower than its value from five business days earlier. At this point, the exposure will be 100% to 3-Month US Treasury bills. From the T-Bill position, the Trendpilot Index will change to the equity position when the Equity Indicator is triggered. It will not return to its 50/50 position unless the Equity Indicator is first triggered.
For more news, information, and strategy, visit the Nasdaq Portfolio Solutions Channel.
The opinions and forecasts expressed herein are solely those of Tom Lydon, and may not actually come to pass. Information on this site should not be used or construed as an offer to sell, a solicitation of an offer to buy, or a recommendation for any product.