Associate Director, U.S. Equity Indices. Indexology Blog
Last year’s prognostications about the events and trends to monitor in 2020 have evaporated as COVID-19 has upended people’s lives and caused massive recalibrations in financial markets. In Q1 2020, we said “goodbye to the bull market”; large market movements became the new normal; correlations and dispersion shifted drastically; quantitative easing returned; and access to liquidity was important for many, in both equity and fixed income markets. Remarkably, all of this took place in little over a month. So much for 2020 foresight!
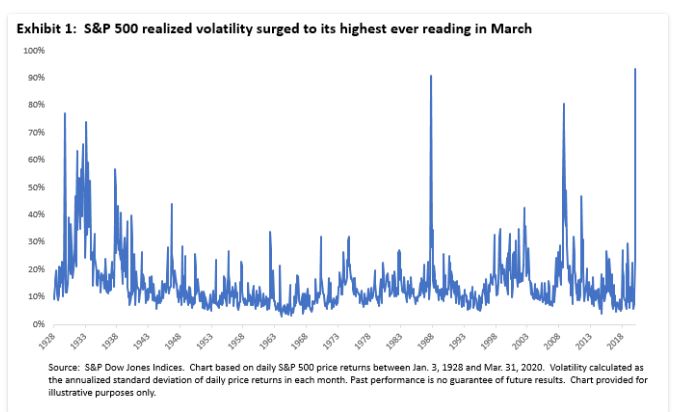
As COVID-19 dominated headlines, the S&P 500 finished with its worst quarterly total return (-19.60%) since Q4 2008’s 22% decline. Matters would have been even worse had it not been for the S&P 500’s best 5-day total return since November 2008; the benchmark rose 17.4% between March 23 and March 30 to recover some of the prior losses. [Through March 23, the S&P 500’s cumulative total returns since the start of the last bull market stood at the same level as in May 2017.] Volatility goes both ways!
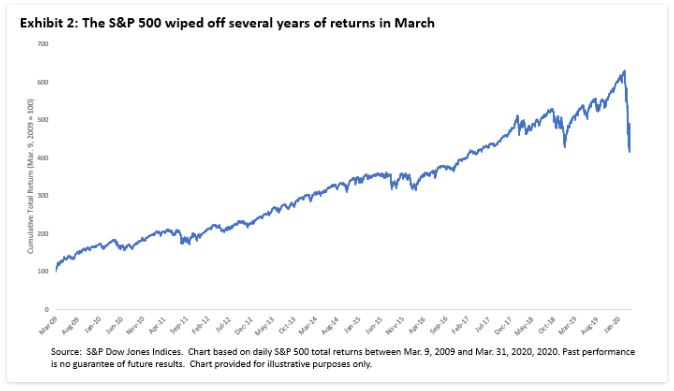
At a sector level, there was no place to hide to avoid declines in absolute terms in Q1: all S&P 500 sectors finished down for the quarter, only the seventh time this has happened since the end of 1989. However, there was enormous value in identifying the relative winners or avoiding the relative losers: a whopping 38.5% separated the best performing sector in Q1 (Information Technology, -11.93%) and the clear laggard (Energy, down 50.45% amid oil prices plunges). This quarterly difference was the highest since December 2001, and reflected a dramatic increase in stock and sector dispersion.
Across the market capitalization spectrum, the S&P 500 beat both the S&P MidCap 400 (-29.70%) and the S&P SmallCap 600 (-32.64%). This may reflect expectations that larger companies may have stronger balance sheets and may be better able to weather the storm.
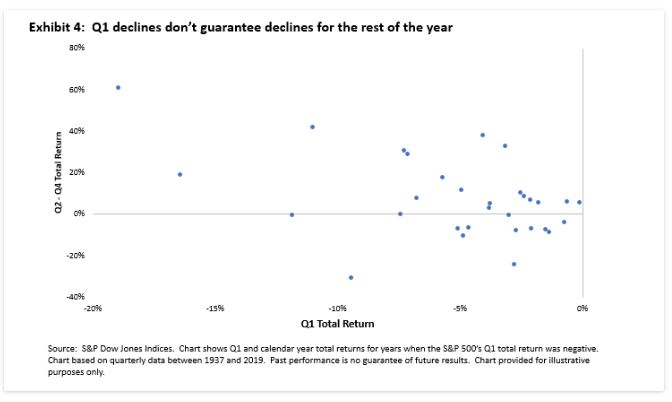
So what’s next? Although the sea of red across dashboards makes for unpleasant reading, it is worth noting that first quarter declines don’t necessarily mean the rest of the year will be negative. For example, the S&P 500 posted 31 negative first quarter total returns between 1937 and 2019. In most cases (19), the benchmark posted a positive return over the next three quarters, including in 2009 when the S&P 500 fell more than 11% in the first three months before rising 42.11% over the last three quarters.
As a result, even though 2020 foresight has gone out of the window, it may be worth staying the course instead of giving up on a possible recovery.