
By Matt Wagner, CFA, Associate Director, Research
Second-quarter earnings gave ammunition to both bulls and bears.
Let’s review a few of the main takeaways of reporting season.
Index Returns
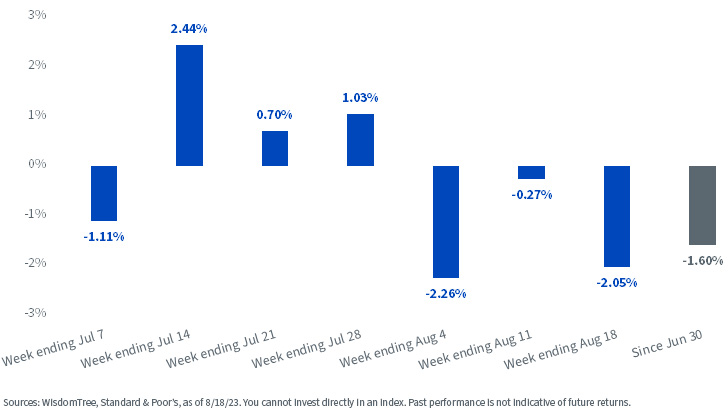
To start, returns have been mixed over the last several weeks.
Returns jumped higher over a three-week stretch ending on July 28. Banks, which generally report earlier in the earnings calendar and are viewed as a key bellwether for the economy, got the earnings season off to a strong start.
When the calendar turned to August, sentiment shifted. The S&P 500 Index entered a three-week losing streak to start the month, tilting S&P 500 returns negative for the quarter.
S&P 500 Total Returns
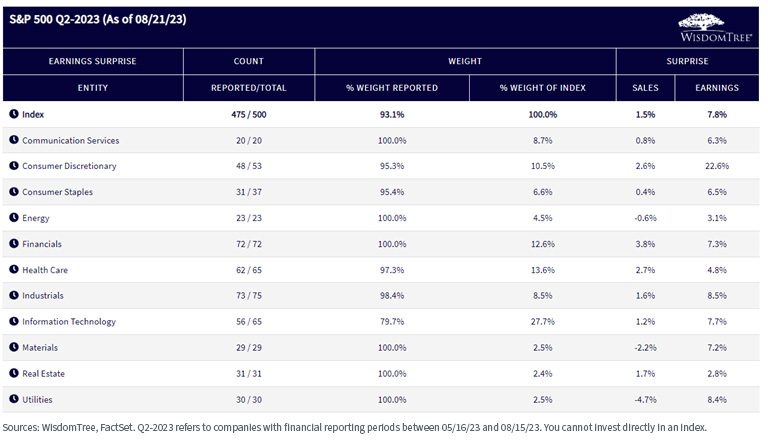
Q2 2023: Surprise
Arguably the negative returns in August had more to do with the spike higher in interest rates than earnings.
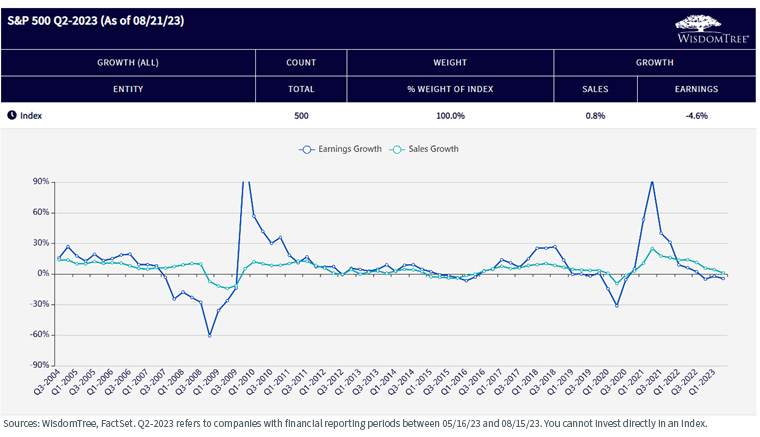
Earnings (with over 90% of the index reporting) beat analyst expectations by nearly 8% in aggregate and across every sector. If you looked no further than this data point, earnings season would be viewed as a home run.
But taking some of the shine off the rosy earnings picture was the lackluster sales surprise. The sales surprise was a modest 1.5%, meaning companies had beaten earnings by controlling costs—a potentially trickier playbook for earnings growth in quarters ahead.
Q2 2023: Growth
Year-over-year earnings declined by 4.6%, with sales effectively flat.
Though earnings growth was negative, the actual results were an improvement from the -7% earnings growth that was expected on June 30.
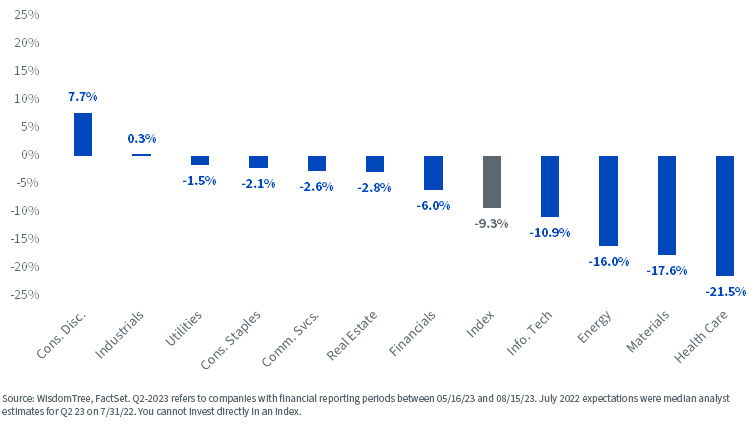
Eight of the 11 sectors had positive earnings growth, with Energy (-52%), Materials (-29%) and Health Care (-28%) the outliers.
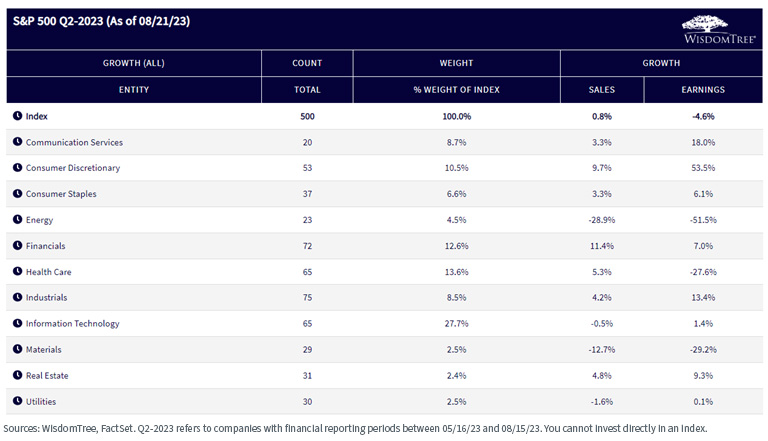
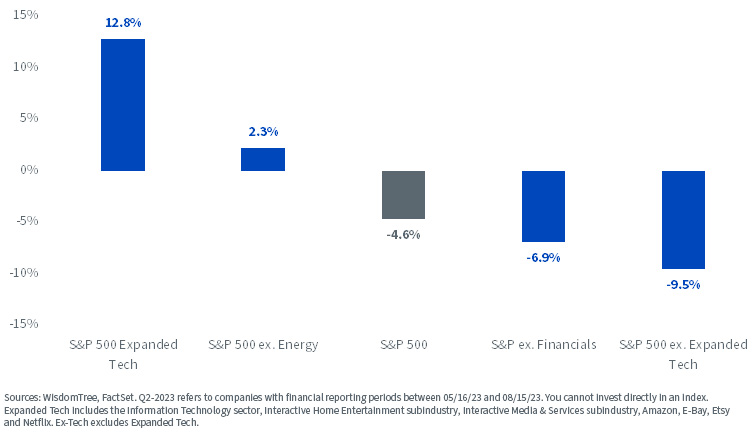
Excluding the volatile earnings from the Energy sector, S&P 500 earnings grew by 2.3%. S&P 500 Expanded Tech grew by nearly 13% with S&P 500 ex. Expanded Tech earnings declining by 9.5%.
Q2 2023 Year-over-Year Earnings Growth
The negative 4.6% earnings growth for the quarter marks the third consecutive quarter of negative earnings growth—the longest stretch since the pandemic-induced earnings recession from Q1 2020 through Q3 2022.
Historical Timeseries: Sales and Earnings Growth
Over the last year, the goalposts had come in significantly on analyst expectations for Q2 2023. Reported earnings growth of -4.6% was 9% below the positive 4.7% growth that was estimated for earnings at the end of July 2022. Energy, Materials and Health Care had the biggest reductions in earnings versus year-ago estimates.
Q2 23 Actual Earnings vs. July 2022 Expectations
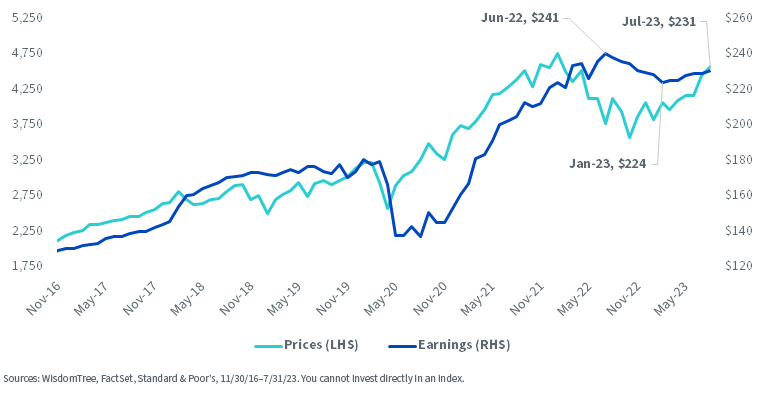
Forward 12-month earnings per share estimates peaked in June 2022 at $241 and troughed at $224 in January 2023 as analysts steadily revised estimates down.
S&P 500 Index Price Level and Forward 12-Month Earnings per Share
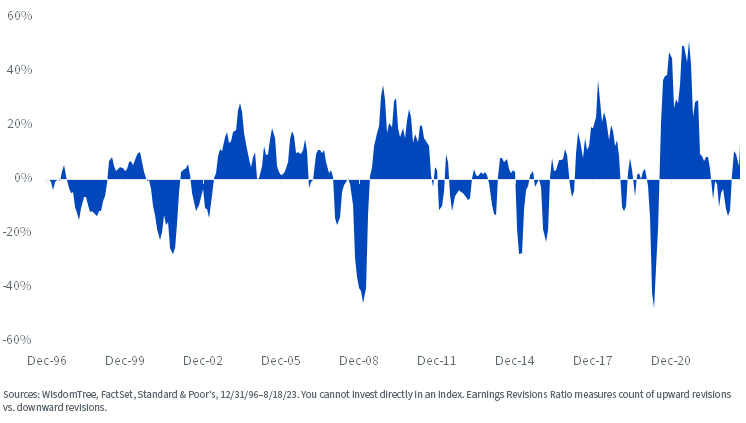
The earnings revisions ratio, which trended negatively for most of last year and into this year, has shown a distinctly positive trend in recent months, mirroring the optimism in equity prices through most of this year.
S&P 500 Index Earnings Revisions Ratio
Looking Ahead
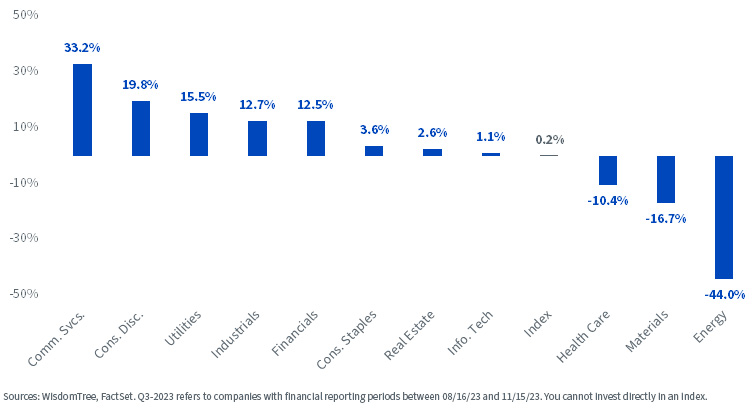
The bar for earnings to beat next quarter is relatively low. Analyst estimates are for Q3 2023 earnings to be roughly unchanged versus the year-ago period.
With just 0.2% earnings growth expected for the index, disappointing earnings could lead to the fourth consecutive quarter of negative growth. That would be longest stretch of negative earnings growth since the five-quarter stretch between Q2 2015 and Q2 2016.
Any surprise to the upside could mean another positive catalyst for equity prices in the second half of the year.
To stay up to date on the latest on earnings, visit the Earnings Path Tool on the WisdomTree website.
Q3 23 Earnings Growth Estimates
Originally published 25 August 2023.
For more news, information, and analysis, visit the Modern Alpha Channel.
