
By Christopher Gannatti, CFA
Global Head of Research
The first eight months of 2023 have been, in a word, surprising. After a difficult 2022 performance year, across multiple asset classes, growth equities are suddenly back in favor. For those of us who have started hearing the phrase, “Magnificent 7,” in reference to the narrow leadership of large Tech companies, it is a reminder of when acronyms like FANG get created. The creation of acronyms or nicknames for shorthand illustrative purposes could be a signal that a rally is getting a bit long in the tooth.
As we write these words, the eyes of the market are focused on Nvidia. This is a company that embodies the 2023 hype around generative artificial intelligence and all of the growth expected to come from that field. Even if it will take years to truly gauge the impact of how generative AI will translate to increased revenues and profits, some days in 2023 one might look at Nvidia’s year-to-date return and figure the market is pricing in all of that future impact immediately.
Even if the people we speak to appreciate Nvidia’s technology and position within the semiconductor market, to a person, they also tend to say something else—Nvidia’s valuation is expensive.
Think about Value before It Heats Up
None of us knows the future, but all of us can recognize there is a difference between finding the Magnificent 7 in late 2022 when stocks and bonds delivered substantially negative returns versus finding these same stocks in August 2023 after they have performed strongly enough to warrant their own nickname. When we mention “value,” it’s about seeking to get ready for that next shift in market leadership.
For the first eight months of 2023 there was the Nasdaq 100 Index and then there were all the other benchmarks. The Nasdaq 100 was so heavily weighted to the Magnificent 7 that it needed to run a special rebalance to re-diversify its exposure.1
The value side of the ledger has been clearly trailing.
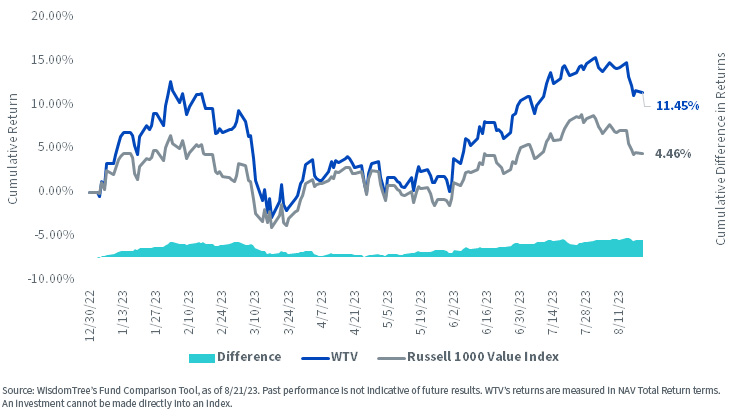
However, we noticed something when comparing the 2023 returns of the Russell 1000 Value Index and the WisdomTree U.S. Value Fund (WTV)2:
- The Russell 1000 Value Index was up roughly 4.46%
- WTV was up roughly 11.45%
That is a significant difference during a period where the overall value style has not been the winning strategy.
Figure 1a: Standardized Returns as of June 30, 2023
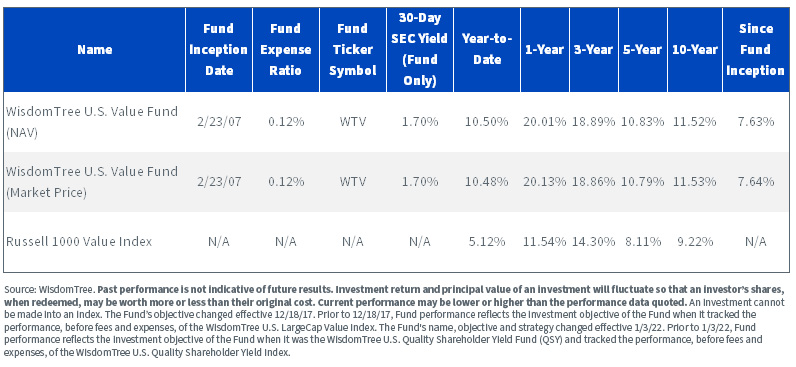
For the most recent month-end performance and 30-day SEC yield, click here.
Figure 1b: WTV Has Significantly Outperformed the Russell 1000 Value Index in 2023
Drivers of the Differentiated Returns
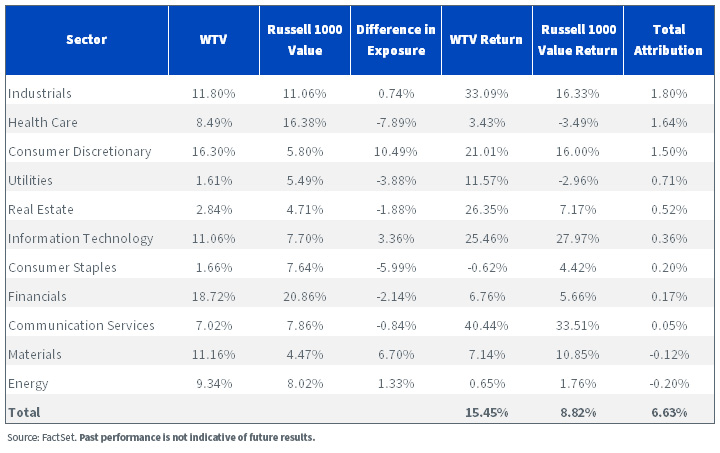
Outperformance, particularly over short periods of time, means very little if we cannot also note why it has occurred and whether its drivers may be maintained over a longer period of time. In figure 2, we can look at the attributions of WTV relative to the Russell 1000 Value Index by sector, and we notice:
- The three sectors with the biggest positive contribution to WTV’s outperformance were Industrials, Health Care and Consumer Discretionary. It’s interesting, in that Industrials was all about stock selection (having a similar weight as the benchmark but stronger performance), Health Care was about being under-weight by nearly 8%, and Consumer Discretionary was about being over-weight by roughly 10.5%. Three sectors, three different ways relative attribution was added.
- Only two sectors during this period were responsible for a negative contribution to relative returns—Energy and Materials. Energy was THE sector to own in 2022, but clearly that situation shifted during 2023.
Figure 2: WTV Sector Attribution vs. Russell 1000 Value Index (12/31/22–7/31/23)
Focusing on Share Repurchases
There are myriad ways to create a value strategy. The journey through the history of asset management might have started with a focus on companies with a high book value relative to market capitalization, but in August 2023, if you can think of a fundamental it’s probably possible to find a strategy that accounts for it.
WisdomTree has been managing dividend-focused equity strategies since 2006. We have frequently been asked some form of the question—what do you do about share buybacks? There are many companies that do extensive share buybacks (think of the big Tech companies), but that do not pay dividends.
If people are wondering whether share repurchases make a difference, we tend to approach the question from two sides, in somewhat of a pincer movement:
- Companies that are able to buy back a lot of shares, reducing their shares outstanding, are making each remaining share eligible for a larger amount of claim to the firm’s profits. It’s also a signal that the firms are not using cash to enrich managers, perform questionable acquisitions or do other things that may be less favorable to future returns.
- Companies that are issuing a lot of shares and increasing their shares outstanding, clearly need money. It’s a signal that the money they need is not yet coming from operating the business, which may not be a positive sign for the long term.
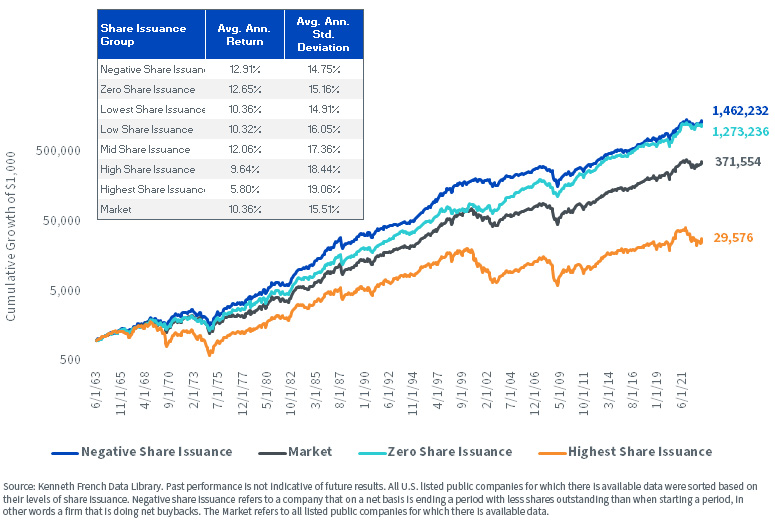
We can test this thinking with data from the Kenneth French Data Library over a long period of time, all the way back to 1963. We see that, in figure 3:
- Companies with negative share issuance outperformed both the market generally as well as companies that were issuing shares. The margin was substantial on an average annual basis, and it was accomplished with lower average annual risk.
- Companies with the highest share issuance (like we mentioned, those that clearly needed money), had the lowest average annual return over this period with the highest average annual standard deviation. This is not a great combination.
Figure 3: Long-Term Performance Impact of Different Levels of Share Issuance (6/30/1963–6/30/2023)
WTV was designed, first and foremost, with a focus on share buybacks and an overall look at the concept of total shareholder yield, which combines dividends and buybacks. The typical company to be included would be likely to have a high total shareholder yield relative to the market, as this is the manner in which WTV accesses what we think of as the value factor.
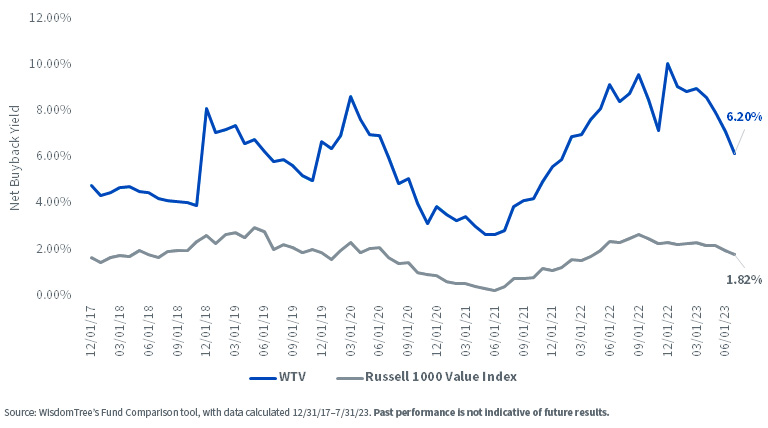
We see here as of July 31, 2023, WTV‘s net buyback yield was 6.20%, versus 1.28% for the Russell 1000 Value Index. If WTV is outperforming—which is what we have seen so far in 2023—this is the first place to look for the underlying rationale.
Figure 4: Quantifying the Net Buyback Yield over Time: WTV vs. Russell 1000 Value Index
Bringing It All Together: Strong Shareholder Yield with Less of the Quality Sacrifice
There are certain longstanding relationships that we see among different factor exposures in equity markets. People might have noticed that growth strategies tend to have lots of exposure to Information Technology stocks, and that these stocks tend toward higher return on equity (ROE) and return on assets (ROA) measures. Value strategies, tending away from Tech exposure, for this and various other reasons may exhibit lower ROE and ROA figures.
Therefore, the typical growth strategy typically exhibits higher quality metrics and the typical value strategy tends to exhibit lower quality metrics. One could also say there is a reason that the stocks comprising the value strategy are less expensive relative to their fundamentals.
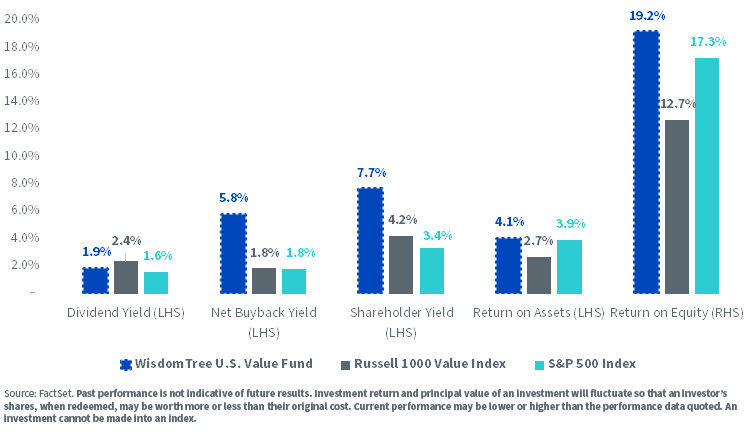
If we look at figure 5, however, WTV had a higher ROE than both the Russell 1000 Value Index and the S&P 500 Index. This is not the usual value relationship. Also, it’s clear that the primary differentiator by way of the fundamentals shown is the net buyback yield. It’s interesting that the Russell 1000 Value Index actually had a higher dividend yield by a small margin than WTV as of this date.
Figure 5: Shareholder Yield and Quality Characteristics (as of 8/21/23)
For the most recent month-end performance click here.
If investors are looking beyond the first eight months of 2023 and considering that the growth rally and leadership of the so-called Magnificent 7 is at risk, WTV might be worth further consideration as a step in the value-oriented direction within U.S. equities.
1Source: https://www.nasdaq.com/articles/the-nasdaq-100-is-undergoing-a-special-rebalance.-heres-how-investors-should-prepare.
2 Source: WisdomTree Fund Comparison tool, with data 12/31/22–8/21/23. WTV’s returns are measured in NAV total return terms.
Originally published by WisdomTree on August 29, 2023.
For more news, information, and analysis, visit the Modern Alpha Channel.
Important Risks Related to this Article
There are risks associated with investing, including the possible loss of principal. Funds focusing their investments on certain sectors increase their vulnerability to any single economic or regulatory development. This may result in greater share price volatility. While the Fund is actively managed, the Fund’s investment process is expected to be heavily dependent on quantitative models and the models may not perform as intended. Please read the Fund’s prospectus for specific details regarding the Fund’s risk profile.
U.S. investors only: Click here to obtain a WisdomTree ETF prospectus which contains investment objectives, risks, charges, expenses, and other information; read and consider carefully before investing.
There are risks involved with investing, including possible loss of principal. Foreign investing involves currency, political and economic risk. Funds focusing on a single country, sector and/or funds that emphasize investments in smaller companies may experience greater price volatility. Investments in emerging markets, currency, fixed income and alternative investments include additional risks. Please see prospectus for discussion of risks.
Past performance is not indicative of future results. This material contains the opinions of the author, which are subject to change, and should not to be considered or interpreted as a recommendation to participate in any particular trading strategy, or deemed to be an offer or sale of any investment product and it should not be relied on as such. There is no guarantee that any strategies discussed will work under all market conditions. This material represents an assessment of the market environment at a specific time and is not intended to be a forecast of future events or a guarantee of future results. This material should not be relied upon as research or investment advice regarding any security in particular. The user of this information assumes the entire risk of any use made of the information provided herein. Neither WisdomTree nor its affiliates, nor Foreside Fund Services, LLC, or its affiliates provide tax or legal advice. Investors seeking tax or legal advice should consult their tax or legal advisor. Unless expressly stated otherwise the opinions, interpretations or findings expressed herein do not necessarily represent the views of WisdomTree or any of its affiliates.
The MSCI information may only be used for your internal use, may not be reproduced or re-disseminated in any form and may not be used as a basis for or component of any financial instruments or products or indexes. None of the MSCI information is intended to constitute investment advice or a recommendation to make (or refrain from making) any kind of investment decision and may not be relied on as such. Historical data and analysis should not be taken as an indication or guarantee of any future performance analysis, forecast or prediction. The MSCI information is provided on an “as is” basis and the user of this information assumes the entire risk of any use made of this information. MSCI, each of its affiliates and each entity involved in compiling, computing or creating any MSCI information (collectively, the “MSCI Parties”) expressly disclaims all warranties. With respect to this information, in no event shall any MSCI Party have any liability for any direct, indirect, special, incidental, punitive, consequential (including loss profits) or any other damages (www.msci.com)
Jonathan Steinberg, Jeremy Schwartz, Rick Harper, Christopher Gannatti, Bradley Krom, Kevin Flanagan, Brendan Loftus, Joseph Tenaglia, Jeff Weniger, Matt Wagner, Alejandro Saltiel, Ryan Krystopowicz, Brian Manby, and Scott Welch are registered representatives of Foreside Fund Services, LLC.
WisdomTree Funds are distributed by Foreside Fund Services, LLC, in the U.S. only.
You cannot invest directly in an index.
