
The potential for stubborn inflation, a higher-for-longer policy from the Federal Reserve and structural $1 trillion deficits have all contributed to an abnormal shape in the U.S. Treasury curve. In this piece we look to other periods of curve inversion and conclude that inverted yield curves are generally not an impediment to equity returns. For fixed income, the impact is more nuanced and depend on when the Fed stops hiking rates.
In a “normal” bond market, the yield curve slopes upward. The structural driver of this yield premium is that investing becomes riskier the further you get into the future. In today’s markets, short-term rates need to remain high to tamp down inflation, but in the future, the Fed is likely to cut rates once the storm has passed.
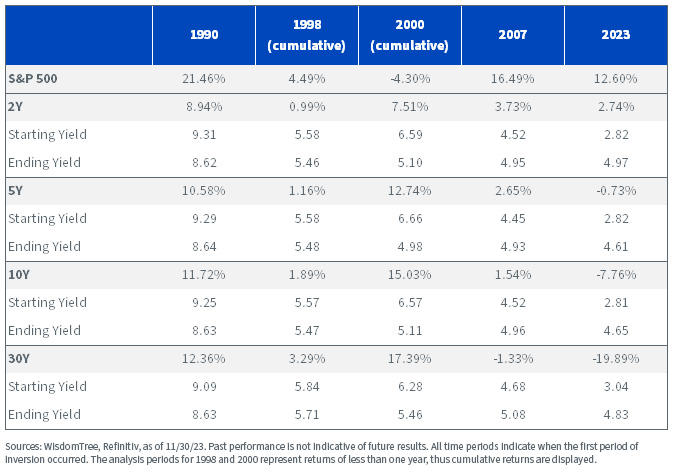
Today, investors can lock in a higher rate of return in exchange for the risk that rates may fall in the future. Over the last 35 years, the U.S. experienced an inverted yield curve in five distinct periods, which we have reviewed from the initial inversion of the two year versus the 10-Year Treasury until that part of the curve ultimately shifted back into positive territory on a sustained basis.
Total Returns vs. Bond Yields
Big Picture
In every episode of yield curve inversion except 2007 and the current episode (2023), bonds delivered positive total returns as a result of falling rates. The challenge today is that not only have bond yields risen dramatically across the curve, but they were at much lower levels when the inversion occurred.
With the exception of 2000, equities significantly outperformed fixed income in this environment despite the implication that inverted yield curves signal a looming recession.
The clear implication for 2023 is that longer duration has underperformed short duration while the curve has been inverted due primarily to rising rates as opposed to lower levels of carry. However, unless investors expect this atypical period to persist, they need to consider when to start positioning for the ultimate pivot from the Fed.
In our view, the key factor that’s driving inversion is that short-term interest rates are too high. Any signals from the Fed that it may be inclined to start cutting rates have resulted in massive rallies for the long end, which has boosted total returns. While this may not result in an upward-sloping curve immediately, investors will have locked in rates not seen since the early 2000s.
We also contrast this with above-average equity performance during an inverted yield curve environment as an opportunity to de-risk. However, this view also depends on timing, which we discuss during specific periods of curve inversion below.
Cumulative Returns: 1/5/89–3/29/90
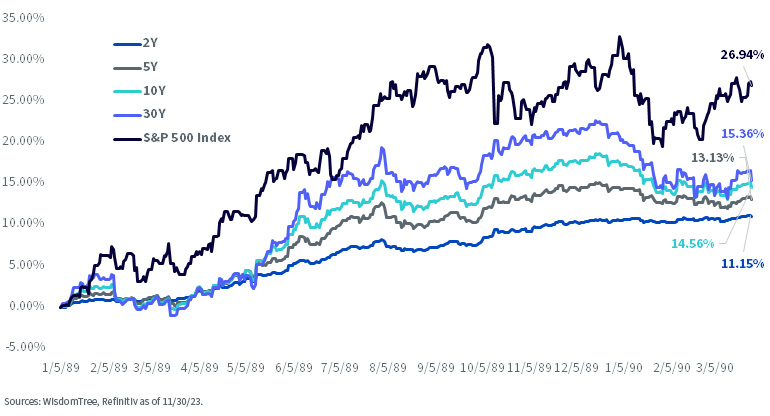
During this period with a flat/inverted curve, fixed income experienced less significant drawdowns on account of higher starting yields. As the Fed started cutting rates in July 1989, duration started to outperform in a big way. The equity market also rallied strongly as the Fed moved away from restrictive policy. However, the U.S. tipped into recession in July 1990, which further favored allocations to fixed income as opposed to equities.
Cumulative Returns: 5/26/98–7/26/98
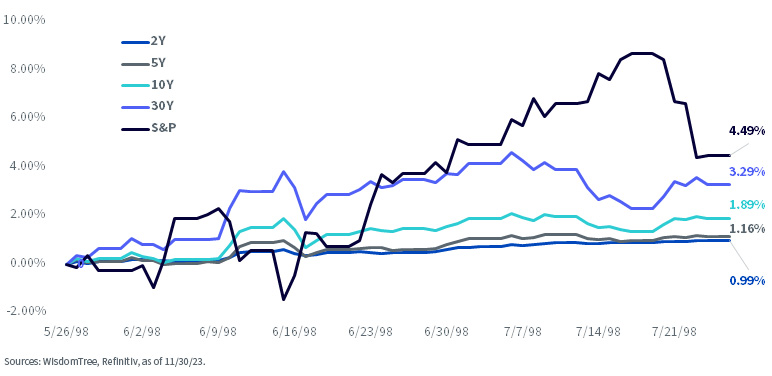
It’s hard to draw too many conclusions from this period of inversion on account of the short period (two months), but fixed income delivered positive total returns over the entire period, albeit at much smaller levels since changes in yields were the primary driver as opposed to income. While equities delivered the highest total returns, this came at the cost of a much more volatile ride.
Cumulative Returns: 2/2/2000–12/28/2000
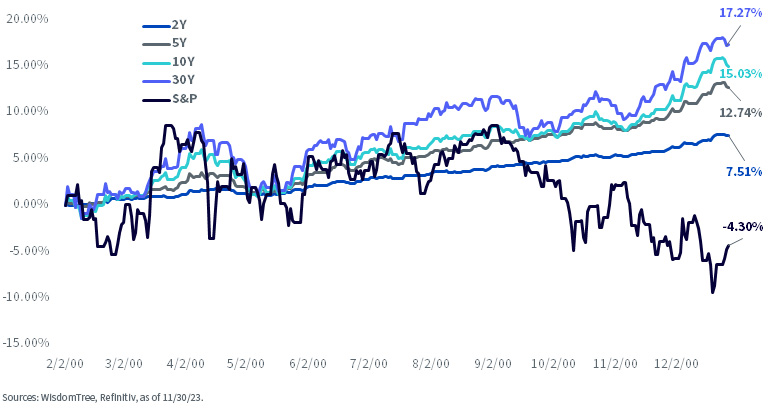
This period coincided with the peak of the dot com bubble in March 2000, and is perhaps the most anomalous for the current environment. Frothy equity markets ultimately resulted in a pullback for stocks whereas longer-term Treasuries rallied. After a final rate hike in July 2000, Treasuries then proceeded to rally as the Fed switched to neutral policy. It may be possible that we see a similar reaction in December 2023.
Cumulative Returns: 1/31/06–6/5/07
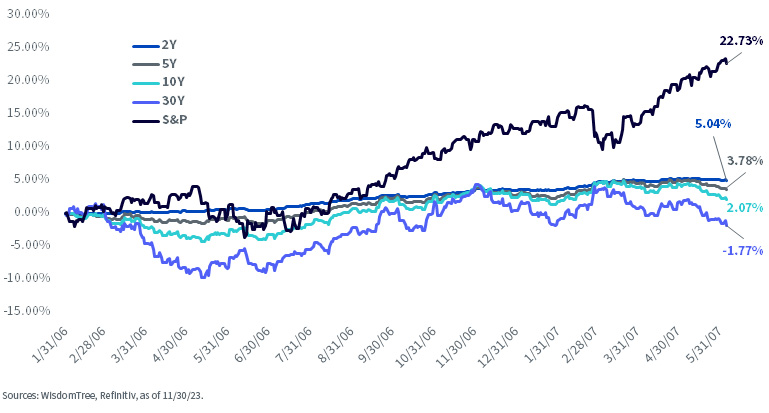
This period is marked by the largest outperformance for equities combined with general underperformance in the bond market, particularly in the long end. The Fed had been gradually tightening policy since 2004 in a measured, predictable fashion. In response, bonds generally languished whereas equities continued to run.
2022–2023
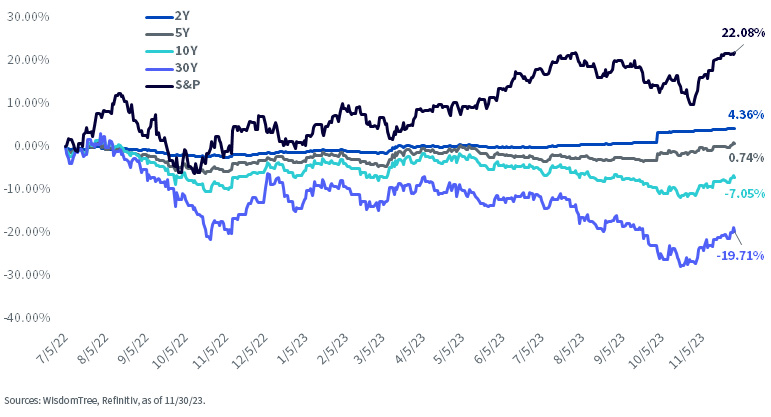
As most investors have been painfully aware, the long end of the Treasury curve has massively underperformed. The big difference during this period is that despite a modest steepening in the yield curve, the spread between 2-Year and 10-Year rates has remained inverted at 35 basis points, which contrasts with the other historical analyses.
For relative value investors, the key question comes down to how much more divergence can occur between long-term bonds and equities. While the timing of that mean reversion is open for debate, given the nearly unprecedented dislocation, it may make sense to make this trade before the Fed fully signals that rates will be falling.
Locking in a total return of nearly 4.5% for 10 years with the added upside potential of falling rates is becoming a more attractive trade, particularly if inflation falls sooner rather than later.
Cumulative Returns: 7/5/22–11/30/23
Conclusion
When the yield curve inverts, assumptions about the bond market get turned on their heads. While equities can generally tolerate inversion better than bonds, we know that markets are dynamic and nothing lasts forever. In light of recent underperformance, it may make sense to start shifting the duration of investor portfolios to take advantage of an eventual shift from the Fed.
In our view, any investor with exposure to a 60/40 allocation should consider the WisdomTree U.S. Efficient Core Strategy (NTSX) as an alternative. With fixed income providing much higher yields, we are more postive about the ability for the strategy to generate returns that differ from a 100% equity allocation given the uncertain otulook for equities heading into 2024.
Originally published 14 December 2023.
For more news, information, and analysis, visit the Modern Alpha Channel.
Important Risks Related to this Article
There are risks associated with investing, including the possible loss of principal. While the Fund is actively managed, the Fund’s investment process is expected to be heavily dependent on quantitative models and the models may not perform as intended. Equity securities, such as common stocks, are subject to market, economic and business risks that may cause their prices to fluctuate. The Fund invests in derivatives to gain exposure to U.S. Treasuries. The return on a derivative instrument may not correlate with the return of its underlying reference asset. The Fund’s use of derivatives will give rise to leverage and derivatives can be volatile and may be less liquid than other securities. As a result, the value of an investment in the Fund may change quickly and without warning and you may lose money. Interest rate risk is the risk that fixed income securities, and financial instruments related to fixed income securities, will decline in value because of an increase in interest rates and changes to other factors, such as perception of an issuer’s creditworthiness. Please read the Fund’s prospectus for specific details regarding the Fund’s risk profile.
