
By Kevin Flanagan, Head of Fixed Income Strategy
One thing we learned, or perhaps was just officially declared, following the just completed November FOMC meeting is that tighter financial conditions are now a key monetary policy input. Powell & Co. had discussed this factor prior to last week’s gathering, but making it arguably the one key addition to the policy statement cemented its role, at least for now. That got me thinking: just how tight are financial conditions anyway?
What the Fed, and the money and bond markets, appeared to be referring to was the surge in Treasury (UST) yields, especially the 10-Year note, over the last few months. Indeed, we have blogged about this topic as well and noted that the UST 10-Year yield touched up against the 5% threshold, representing a 16-year high watermark.
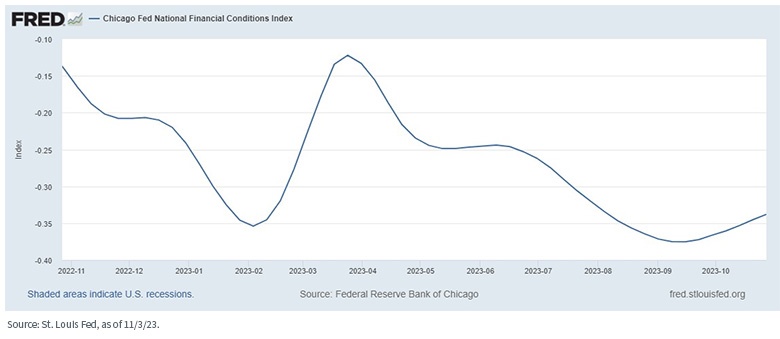
However, I wanted to delve a little deeper and see how a broader measure of financial conditions was doing and not just rely on Treasury yields, or even the dollar and credit spreads. Enter the Chicago Fed National Financial Conditions Index. This gauge is released weekly and contains 105 components. Why is that important, you may ask? Well, an index with that many inputs is far less likely to be skewed by developments than one that only has a handful.
What I discovered analyzing the Chicago Fed gauge was rather interesting. Yes, there has been some tightening since early September, but overall, financial conditions are still more tilted toward the “looser” side of the equation. In fact, the index level actually fell (loosened) from mid-July, when the UST 10-Year yield essentially began its run to higher yield levels. Taking it one step further, according to this measure, financial conditions are not too far removed from where they were prior to the regional banking turmoil earlier this year.
U.S. Treasury 10-Year Yield
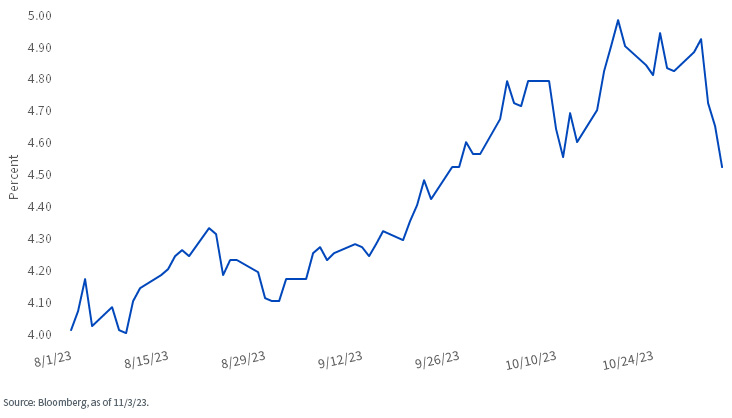
OK, so back to the UST 10-Year yield. You know what’s happened recently? As I write this blog post, the 10-Year has seen its yield drop almost 50 basis points (bps) since testing the 5% threshold about two weeks ago, with 40 bps of this decline occurring since last week’s FOMC meeting. In addition, the dollar has fallen while U.S. credit spreads have narrowed post-Fed as well.
Conclusion
Does this mean the Fed will suddenly strike a more “hawkish” tone in the weeks/month ahead? No, not necessarily. In my opinion, it is still “all about the data.” Labor market activity and inflation remain the key ingredients to pay attention to.
Originally published 8 November 2023.
For more news, information, and analysis, visit the Modern Alpha Channel.