
By Brian Manby, CFA, Associate, Investment Strategy
To the casual equity market observer, 2023 has been an excellent year. The S&P 500 is up 13.07% through September, while the technology-heavy NASDAQ surged 35%.
But therein lies the problem. Excitement surrounding artificial intelligence (AI) has sent large-cap tech companies soaring despite corresponding increases in real interest rates, which normally weigh on prospects for the sector. Consequently, information technology, which comprises almost 30% of the S&P 500, is responsible for nearly two-thirds of the index’s gains year-to-date.
This year’s rally leaves equities in a precarious position where recent returns look attractive but prevailing valuations appear frothy due to narrow market leadership and minimal breadth supporting the index.
Market Multiples Leave Much to Be Desired
Through September, the spread between the 20th and 80th percentile of forward price-to-earnings (P/E) valuations among S&P 500 companies is about 14 points. That spread alone is a 67th percentile observation relative to index history going back to mid-1995. That marks a modest “recovery” in valuations after a 77th percentile reading in August.
S&P 500 Forward P/E Dispersion: 20th & 80th Percentiles
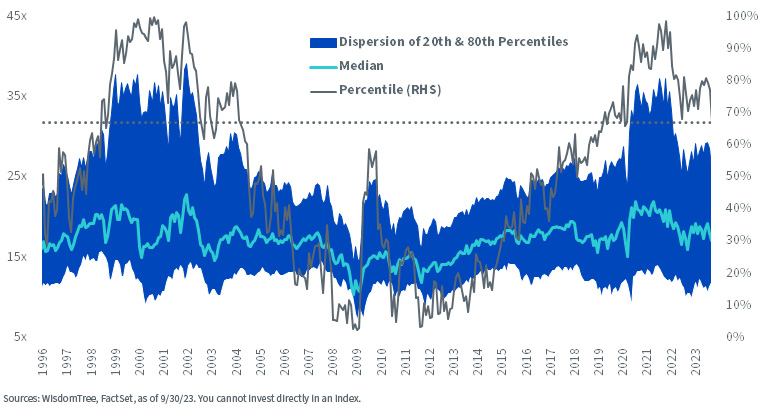
Meanwhile, the median forward P/E is about 17 times next year’s earnings, a bit closer to the 20th percentile observation of 11 times than the 80th at 26 times. Both the 20th percentile and median observations are virtually unchanged from the start of the year, while the 80th percentile is also now back where it began 2023 after climbing to 31 times during the summer.
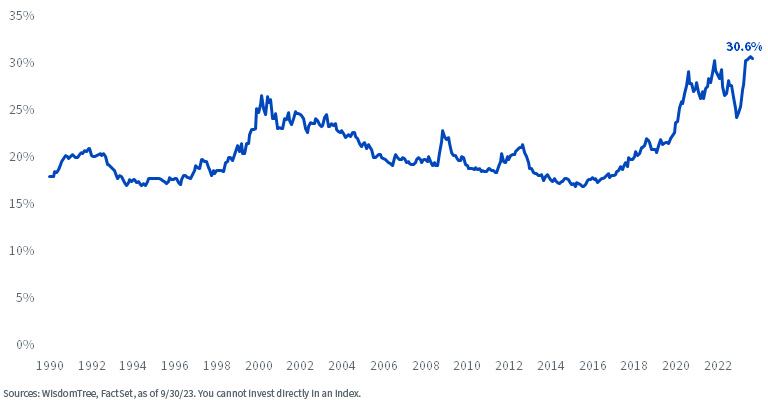
For the 10 largest companies in the S&P 500, however, multiple expansion has been more pronounced. The forward P/E of the top 10 names registered a modest 20 times next year’s earnings at the end of 2022 but has grown to 27 times at the end of September, marking a slight decline from summertime readings near 31 times. Meanwhile, the S&P 500 is historically concentrated in its top 10 companies, whose combined weight is over 30% of the index and the second-largest observation in our 33 years of data, following August at 31%.
Weight of Top 10 Companies in S&P 500 Over Time
Mixed Signals from 2023’s “Melt-Up”
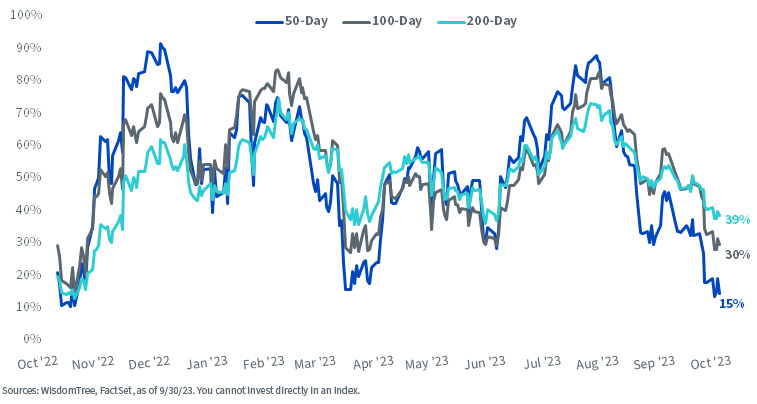
This year’s “melt-up” in equity valuations coincides with a steep decline in market breadth. The percentage of companies trading above their 50-, 100- and 200-day moving averages are all near their lows over the past year and have steadily declined since July.
% of S&P 500 Companies Trading Above their Moving Averages
The narrow leadership illustrates another deficiency of traditional, market cap-weighted equity indexes, where the largest companies power markets higher while the remaining majority enjoy comparatively little upside.
During these episodes, investors are punished for adhering to the tenets of prudent investing, such as emphasizing fundamentals and maintaining a diversified equity portfolio. Those who are unperturbed by this year’s concentrated rally, however, may find solace in fundamentally-focused equity allocations that may benefit if today’s top-heavy market reverses course.
Don’t Wait for Earnings…Weight by Earnings
Earnings have long been considered the proverbial gas pedal that drives markets higher, but prices can quickly decouple from the fair value of those future profits. This is an innate flaw of market cap-weighted equity methodologies because valuations do not adjust as markets climb higher. Instead, investors are forced to pay many multiples of company earnings for desired exposure.
Earnings-weighted approaches, however, have a distinct advantage that counters runaway multiple expansion. If companies are weighted by their earnings, as opposed to investors buying and waiting for those future earnings, then multiples remain suppressed and create more palatable investment opportunities.
TheWisdomTree U.S. LargeCap Fund (EPS) employs this exact methodology. Like the S&P 500, it contains the 500 largest U.S. companies, but the weighting scheme places more emphasis on trailing profits.
Reduced valuations are a key byproduct. By nearly every measure we track, it exhibits a discounted multiple versus the S&P 500 by at least a few points.
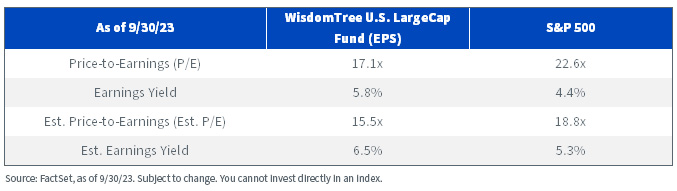
More importantly, it delivers core U.S. large-cap exposure at reasonable valuations versus the market. At 15.5 times forward earnings and 3.3 points lower than the market, there is a 1.2% forward earnings yield advantage at a time when investors are concerned about historically low equity risk premiums. On a trailing earnings basis, the valuation differential is more pronounced, with EPS’s P/E nearly six points lower than the S&P. Meanwhile, the weighted average forward P/E of the top 10 companies is about 6 points lower than those within the S&P 500, at 21 times next year’s earnings compared to 27 times through September.
Earnings-weighted methodologies are just another example of the myriad ways to obtain core U.S. equity exposure. However, they reinforce that investors do not need to be relegated to the sidelines purely because of 2023’s narrow market leadership and the shortcomings of conventional weighting approaches.
Palatable opportunities remain if investors are willing to step outside the comfort zone of traditional market cap-weighting, and the WisdomTree U.S. LargeCap Fund (EPS) may be a worthwhile introduction.
Originally published 10 October 2023.
For more news, information, and analysis, visit the Modern Alpha Channel.
Important Risks Related to this Article
There are risks associated with investing, including the possible loss of principal. Funds focusing their investments on certain sectors increase their vulnerability to any single economic or regulatory development. This may result in greater share price volatility. Please read the Fund’s prospectus for specific details regarding the Fund’s risk profile.
