
By Caleb Sevian
Thought to ponder…
“As Kahneman writes in Thinking, Fast and Slow, ‘Whenever we can replace human judgment by a formula, we should at least consider it.’ If we are not careful, we forget those last four words and mistakenly feel that whenever we can replace judgment with a formula, we should do so. We are always searching for a formula, a calculation that will remove the uncertainty. Formulas are simple. That’s a feature, but also a bug. Life is complicated.
Russ Roberts
Wild Problems
The View from 30,000 feet
Last week was another difficult week for the markets with Equities, Treasuries and Commodities all engaging in a synchronized selloff sparked by interest rates testing cycle highs and a steady stream of negative news flow related to the Chinese economy. Equities and Commodities have each been down for three consecutive weeks and Treasuries for five consecutive weeks. The main culprits responsible for the market selloffs? 1. Over bought conditions. 2. Concern of too much momentum in the U.S. economy that will restoke inflation 3. Increased interest rates pressuring growthy names that have run up in 2023 based on multiple expansion 4. Worries that China is slipping into debt deflation that will ultimately lead to a liquidity trap. Over the summer the markets became priced for a world that included less inflationary pressure and a return to a lower rate environment. The markets discounted the outcome, stretched higher and became susceptible to disappointments to the base case that included an aggressive easing cycle by the Fed and a resumption of unrestricted growth. What we’re seeing in the markets resembles indigestion when realities are different than the consensus view.
- Equity markets were extended and due to blow off some steam
- Sweden and South Korea, who each tend to lead global manufacturing cycle, are showing signs of life
- US data upside blow outs and sky rocketing GDP expectations highlight Fed concerns and cause repricing of rate expectations
- The most Frequently Asked Question from clients this week: What would it take for the equity markets to have durable rally?
Equity markets were extended and due to blow off some steam
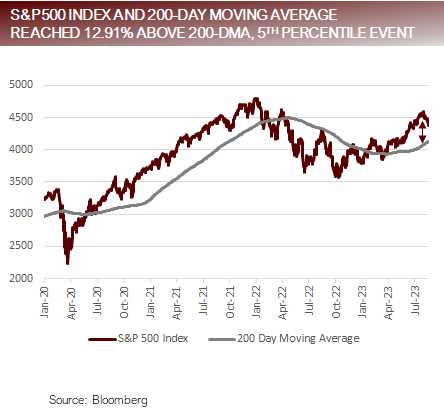
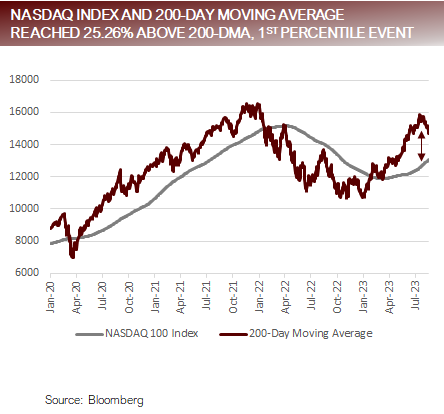
Just how over bought were the markets?
- On July 19, the S&P500 Index was closed 12.91% above its 200-Day Moving Average, which was in the top 5.0% of days with the largest range above the 200-Day Moving Average over the last 20 years.
- On July 17, the NASDAQ 100 Index closed 25.26% above its 200-Day Moving Average, which was in the top 0.40% of days with the largest range above the 200-Day Moving Average over the last 20 years.
- The S&P500 was overbought, and the NASDAQ 100 was extremely overbought.
- The S&P500 Index had 12 episodes in the last 20 years where the distance above the 200-Day Moving Average was more than 10% for 10 days or more. Excluding the pandemic, which had some unique attributes because of the on/off nature of March 2020, there were zero instances in the last 20 years where the S&P500 Index trade below the 200-Day Moving Average within the next six months following, suggesting the uptrend will remain intact based on historical paradigms.
Bottom Line
- The equity markets are still in an uptrend. Technical pullbacks and consolidations are a natural event that occurs when the buying rubber band gets too stretched. To say the NASDAQ 100 was stretched is an understatement. The danger is that quantitative programs tied to trend following systems become forced sellers due to technical levels being breached or volatility triggers, which could lead to an exaggerated move lower towards resistance points, however the fundamental picture has not changed, so it’s unlikely that the momentum to the upside will be interrupted for anything other than a normal pullback or consolidation.
Pullback or consolidation to be expected because markets were too stretched
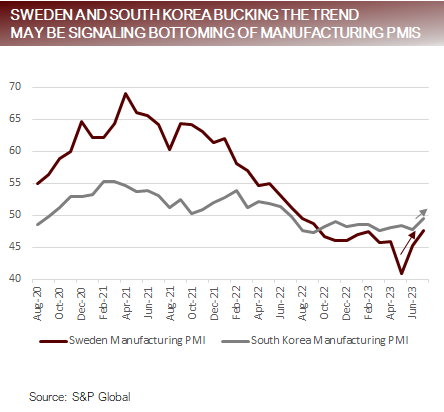
Sweden and South Korea are showing signs of life
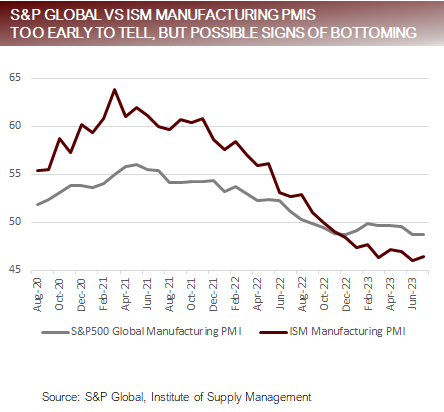
- Global Manufacturing PMIs, which tend to be a good leading indicator economic activity continue to weaken. Out of 24 countries that the S&P PMIs measure, June’s latest readings show that only five countries remain above 50, in the expansion zone, whereas 19 are in the contraction zone. More countries entering contraction has been a trend, with two countries entering contraction in June, one in May and two in April.
- Two important countries are signaling that tides may be turning. Sweden and South Korea. Both countries occupy unique places in manufacturing cycle that have historically made them places to look for turning points.
- Sweden moved higher last month by 2.4 points to 47.6, continuing its trend higher, now increasing 6.7 points over the last two months. Sweden’s new order to inventory ratio is a nuanced way to analyze the move higher and gave an even more compelling signal as new orders increased while inventories fell.
- South Korea showed similar strength with the export component, a closely watched indicator of global wholesale demand, moved above the key 50 threshold for the first time since February 2022.
- Although signs of export strength in South Korea is good news, the strength seems to be isolated to the US. Singapore registered double digit loses to the EU, Taiwan and South Korea, but exports to the US surged 34.4%.
Bottom Line
- Key parts of the global supply chain and demand are showing signs of turning higher. However, the strength seems to be centered around isolated economic strength in the US and it’s far too early to tell if the recent uptick will be the beginning of a trend, but the recent uptick is an encouraging sign that manufacturing may be bottoming.
Apart from China, which is in a tailspin, other area of global manufacturing may be bottoming
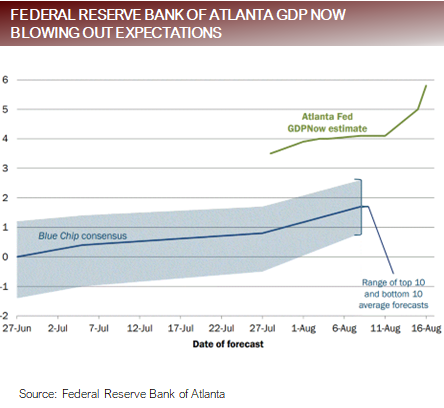
US data upside blow outs, sky rocketing GDP expectations highlight Fed concerns
Equity market performance is being driven by the repricing based on higher rates driven by last week’s economic data.
- Retail Sales – Control Group, which feeds into GDP came in at +1.0% beating, survey expectations of +0.5%, marking the second strongest month of 2023.
- Housing Starts – Jumped +3.9% month-over-month, eclipsing survey expectations of +1.1%. However, not all news was good, the NAHB Housing Index, which measured builder sentiment, fell sharply to 50 (below 50 is considered a contraction), well below the survey expectations of 56.
- Industrial Production – Surged +1.0% versus survey of +0.3%, marking the first positive month in the last three months, largely driven by motor vehicle manufacturing production.
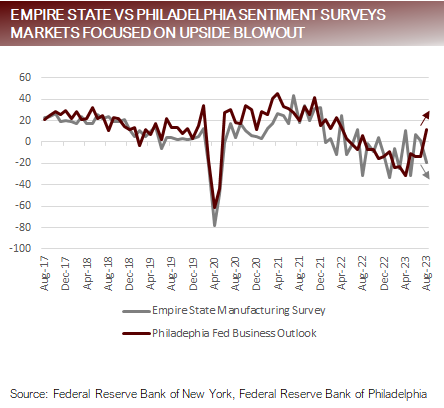
- Philadelphia Fed Business Outlook – Skyrocketed to +12.0, versus survey expectations of -10.4, marking the highest measurement since April of 2022, and the largest one-month net change since June of 2020.
- Fed Minutes – Comments centered around risks for inflation outweighing risks to growth, which given this month’s data seems spot on.
- Atlanta Fed GDPNow – Running at a shocking 5.8% annualized rate, well above virtually anyone’s forecast. Keep in mind this is a nowcast, which is much different than a forecast, so economists are largely being discounting it as something to expect, but it creates a convincing case that the economy is growing above potential.
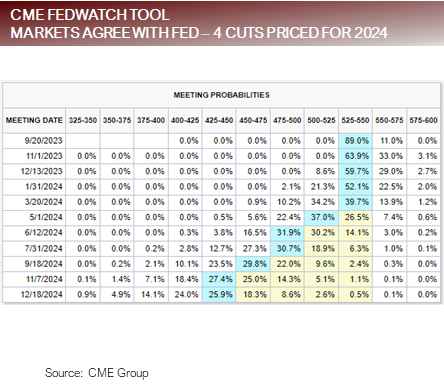
- Markets have repriced rate cut expectations, trimming one rate cut out of 2024, now closely matching the Fed’s summary of Economic Projections last released in June, which called for four rate cuts in 2024.
- On balance, the data was stronger last week, in some cases almost alarmingly stronger. However, markets keyed on positive data, largely ignoring weaker data, such as the Empire Manufacturing Survey which fell through the floor, builder sentiment and slower sales traffic trends in housing due rates creeping higher.
Markets are spooked and focusing on signs of stronger than expected growth
FAQ: What would it take for the equity markets to have durable rally?
We’d like to see three things develop that would signal a durable rally:
- Lower interest rates from the Fed (for the right reason): The right reasons are that inflation will continue to fall, which in turn have the effect of raising real rates. The Fed is focused on real rates and won’t let them get too stretched because the economy cannot sustain high real rates. The wrong reasons are that the economy craters, but the long-term effects have a similar outcome – lower rates will sow the seeds of market expansion, just a much different path to get there.
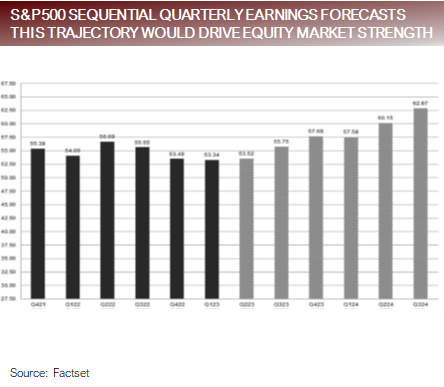
- Earnings follow-through: Sequential quarterly earnings growth for the S&P500, which provides some additional depth over the annual numbers, looks to have bottomed in Q12023 and is forecasts to trend higher in 2024. If the earnings numbers meet expectations, annual earnings growth will be 11.9%, which is well above average and would be associated with above average economic growth that should filter into the equity markets.
- Credit growth expansion: Ultimately loan supply and demand will be tied to lower rates and an improvement of sentiment that business conditions and asset prices are stable. These conditions go hand in hand with a Fed that is lowering rates for the right reasons.
The markets are discounting mechanism, so they rallied in 2023 in anticipation of these events. In other words, the markets are priced for a durable rally, which lowers the upside if it transpires and creates a gap if expectations are not met.
Lower rates combined with above average earnings growth a positive momentum signal
Putting it all together
- The markets are in a seasonally difficult period. Equities, Treasuries and Commodities all have unique drivers that are creating headwinds.
- Equities – Digesting dramatically overbought conditions
- Treasuries – Over supply, Bank of Japan YCC changes, Inflation / Growth Concerns, Ratings Downgrade
- Commodities – Growth worries about China
- Over the first half of 2023 the markets became priced for perfection – disinflation and continued growth. Growth that was viewed as a sign of resiliency and an asset, is now becoming viewed as a liability and highlighting the risk that the Fed will have trouble containing inflation and will have to keep rates higher for longer.
- Much of the market’s recent indigestion is centered around the struggle to conceptualize what pricing should look like in a world with persistent inflationary pressures and rates that don’t recede, which is looking ever more likely.
- To complicate the environment, the Fed has its back against the wall because in an ideal world they’d stay out of the rate raising and cutting game during an election year, which is quickly approaching, but it doesn’t look like they will have enough information to determine which side of the fence the land on in time to not become a part of the political landscape.
DISCLOSURES AND IMPORTANT RISK INFORMATION
Performance data quoted represents past performance, which is not a guarantee of future results. No representation is made that a client will, or is likely to, achieve positive returns, avoid losses, or experience returns similar to those shown or experienced in the past.
Focus Point LMI LLC
For more information, please visit www.focuspointlmi.com or contact us at [email protected]
Copyright 2023, Focus Point LMI LLC. All rights reserved.
The text, images and other materials contained or displayed on any Focus Point LMI LLC Inc. product, service, report, e-mail or website are proprietary to Focus Point LMI LLC Inc. and constitute valuable intellectual property and copyright. No material from any part of any Focus Point LMI LLC Inc. website may be downloaded, transmitted, broadcast, transferred, assigned, reproduced or in any other way used or otherwise disseminated in any form to any person or entity, without the explicit written consent of Focus Point LMI LLC Inc. All unauthorized reproduction or other use of material from Focus Point LMI LLC Inc. shall be deemed willful infringement(s) of Focus Point LMI LLC Inc. copyright and other proprietary and intellectual property rights, including but not limited to, rights of privacy. Focus Point LMI LLC Inc. expressly reserves all rights in connection with its intellectual property, including without limitation the right to block the transfer of its products and services and/or to track usage thereof, through electronic tracking technology, and all other lawful means, now known or hereafter devised. Focus Point LMI LLC Inc. reserves the right, without further notice, to pursue to the fullest extent allowed by the law any and all criminal and civil remedies for the violation of its rights.
All unauthorized use of material shall be deemed willful infringement of Focus Point LMI LLC Inc. copyright and other proprietary and intellectual property rights. While Focus Point LMI LLC will use its reasonable best efforts to provide accurate and informative Information Services to Subscriber, Focus Point LMI LLC but cannot guarantee the accuracy, relevance and/or completeness of the Information Services, or other information used in connection therewith. Focus Point LMI LLC, its affiliates, shareholders, directors, officers, and employees shall have no liability, contingent or otherwise, for any claims or damages arising in connection with (i) the use by Subscriber of the Information Services and/or (ii) any errors, omissions or inaccuracies in the Information Services. The Information Services are provided for the benefit of the Subscriber. It is not to be used or otherwise relied on by any other person. Some of the data contained in this publication may have been obtained from The Federal Reserve, Bloomberg Barclays Indices; Bloomberg Finance L.P.; CBRE Inc.; IHS Markit; MSCI Inc. Neither MSCI Inc. nor any other party involved in or related to compiling, computing or creating the MSCI Inc. data makes any express or implied warranties or representations with respect to such data (or the results to be obtained by the use thereof), and all such parties hereby expressly disclaim all warranties of originality, accuracy, completeness, merchantability or fitness for a particular purpose with respect to any of such data. Such party, its affiliates and suppliers (“Content Providers”) do not guarantee the accuracy, adequacy, completeness, timeliness or availability of any Content and are not responsible for any errors or omissions (negligent or otherwise), regardless of the cause, or for the results obtained from the use of such Content. In no event shall Content Providers be liable for any damages, costs, expenses, legal fees, or losses (including lost income or lost profit and opportunity costs) in connection with any use of the Content. A reference to a particular investment or security, a rating or any observation concerning an investment that is part of the Content is not a recommendation to buy, sell or hold such investment or security, does not address the suitability of an investment or security and should not be relied on as investment advice.
This communication reflects our analysts’ current opinions and may be updated as views or information change. Past results do not guarantee future performance. Business and market conditions, laws, regulations, and other factors affecting performance all change over time, which could change the status of the information in this publication. Using any graph, chart, formula, model, or other device to assist in making investment decisions presents many difficulties and their effectiveness has significant limitations, including that prior patterns may not repeat themselves and market participants using such devices can impact the market in a way that changes their effectiveness. Focus Point LMI LLC believes no individual graph, chart, formula, model, or other device should be used as the sole basis for any investment decision. Focus Point LMI LLC or its affiliated companies or their respective shareholders, directors, officers and/or employees, may have long or short positions in the securities discussed herein and may purchase or sell such securities without notice. Neither Focus Point LMI LLC nor the author is rendering investment, tax, or legal advice, nor offering individualized advice tailored to any specific portfolio or to any individual’s particular suitability or needs. Investors should seek professional investment, tax, legal, and accounting advice prior to making investment decisions. Focus Point LMI LLC’s publications do not constitute an offer to sell any security, nor a solicitation of an offer to buy any security. They are designed to provide information, data and analysis believed to be accurate, but they are not guaranteed and are provided “as is” without warranty of any kind, either express or implied. FOCUS POINT LMI LLC DISCLAIMS ANY AND ALL EXPRESS OR IMPLIED WARRANTIES, INCLUDING, BUT NOT LIMITED TO, ANY WARRANTIES OF MERCHANTABILITY, SUITABILITY OR FITNESS FOR A PARTICULAR PURPOSE OR USE. Focus Point LMI LLC, its affiliates, officers, or employees, and any third-party data provider shall not have any liability for any loss sustained by anyone who has relied on the information contained in any Focus Point LMI LLC publication, and they shall not be liable to any party for any direct, indirect, incidental, exemplary, compensatory, punitive, special or consequential damages, costs, expenses, legal fees, or losses (including, without limitation, lost income or lost profits and opportunity costs) in connection with any use of the information or opinions contained Focus Point LMI LLC publications even if advised of the possibility of such damages.
For more news, information, and analysis, visit the Modern Alpha Channel.
