
By Scott Welch, CIMA ®, Chief Investment Officer – Model Portfolios
Once I built a tower up to the sun
Brick and rivet and lime
Once I built a tower, now it’s done
Brother, can you spare a dime?
Say, don’t you remember, they called me Al
It was Al all the time
Why don’t you remember, I’m your pal
Say buddy, can you spare a dime?
(From “Brother, Can You Spare a Dime?” written by Yip Harburg and Jay Gorney, 1930, made popular by Bing Crosby, 1932)
In our first of two blog pieces, we focused on consumer and investor sentiment and behavior. Here, we look at related individual and consumer metrics regarding employment.
The “Headline” Numbers
The overwhelming media and investor attention is paid to two “headline” metrics—non-farm payrolls and “U-2,” or the overall unemployment rate (not the band):

While employment has risen steadily and unemployment has fallen likewise, neither has recovered their level from prior to the onset of the COVID-19 pandemic.
The Richmond Federal Reserve Bank forecasts further declines in the headline U-2 number, especially following the recent passage of the $1.9 trillion fiscal stimulus package:
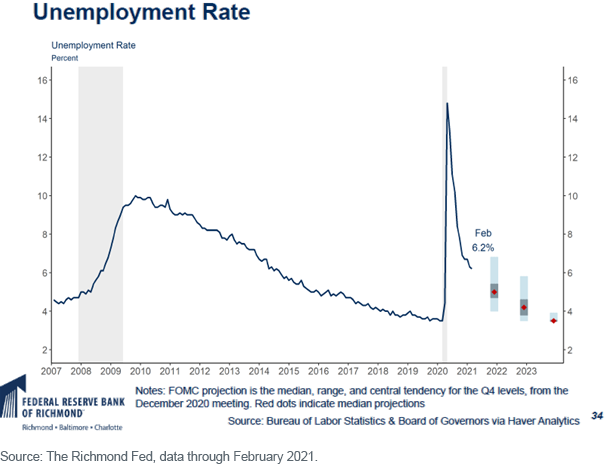
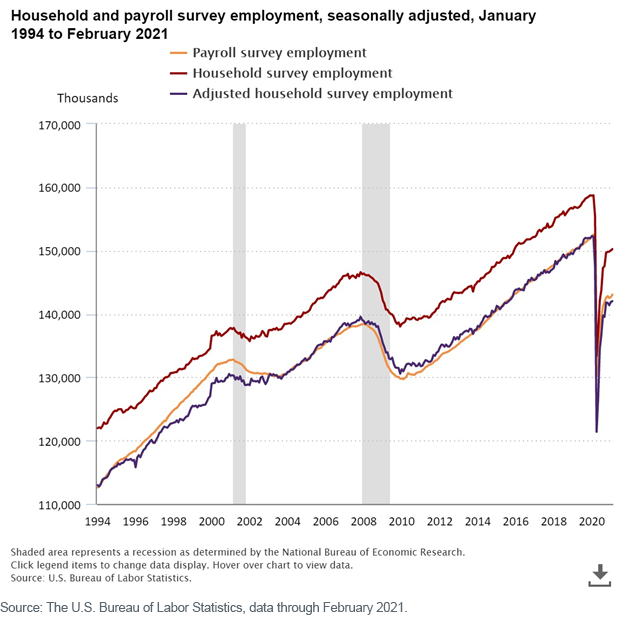
When looking at employment and payroll numbers, it is helpful to distinguish between the household and establishment survey numbers. The household number is calculated by surveying 60,000 families about their employment status, and any individual with more than one job is only counted once. This data is the source for the reported unemployment rate number in the chart above.
The establishment number is calculated from a monthly survey of approximately 144,000 businesses and government agencies, representing approximately 697,000 workers. In this survey, a given worker with more than one job will be counted for each job held. This data is the source for the non-farm payroll number in the chart above.
Because of the calculation differences, these numbers can show divergent employment pictures over short periods of time (though they tend to converge over the longer term).[1]
The “Numbers Behind the Numbers”
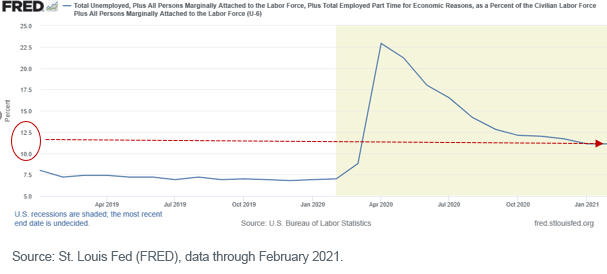
Let’s now look at some of the “numbers behind the numbers.” First up is the “U-6” rate, which captures not just the unemployed but also those workers employed part time for economic reasons and workers only “marginally attached” to the workforce. In many respects, this number (which currently hovers around 11%) probably represents a more accurate picture of how many workers view the employment scene.
Since the U-2 rate is a function of how many people are actually in the workforce, it is also useful to examine the labor participation rate (the percent of eligible workers who are in the workforce) and the employment/population ratio (the percent of the overall population who are employed):
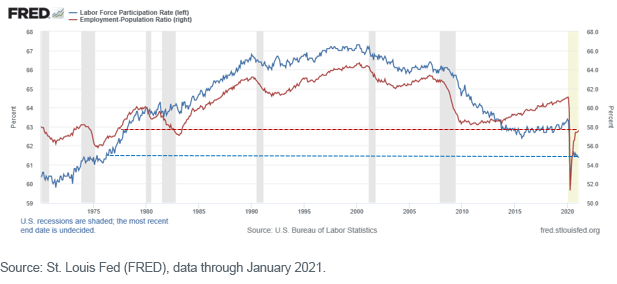
While both ratios have rebounded from their pandemic lows, they remain at levels not seen since the mid-1970s—when women entered the measured workforce in large numbers for the first time. Translation: If we were at labor force participation rates near the all-time highs of the early 2000s, the reported unemployment rate would be much higher.
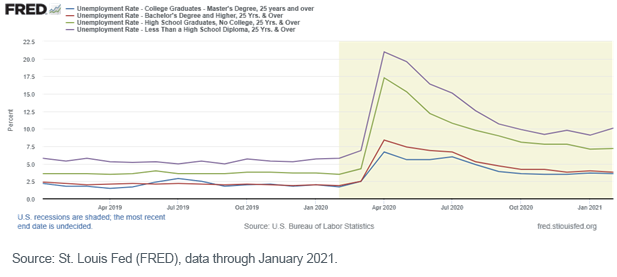
Further, a worker’s ability to find employment is very much a function of their level of education as the U.S. increasingly evolves to a “knowledge economy”:
Another interesting set of data focuses on job openings and the “hires” and “quits” rates. Job openings and hiring rates are self-explanatory, but the quits rate is a measure of worker confidence—the higher the rate, the more confident a given worker is that they can “quit” their current job and find another one.
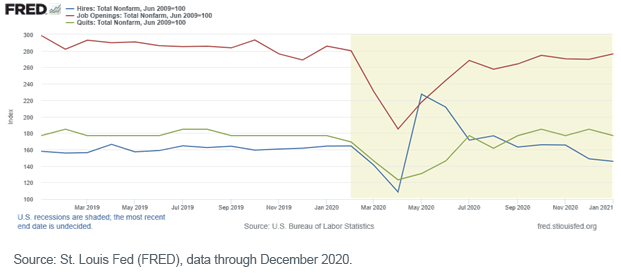
While the reported number of job openings has grown steadily since the depths of the pandemic recession, the hiring and quits rates are at levels near or below pre-recession levels. The hiring rate, perhaps, is attributable to employers unable to find sufficient qualified workers to fill open positions, but the quits rate suggests employed workers are growing less confident about their ability to change jobs.
“Flash” or Concurrent Numbers
Lastly, let’s examine two “flash” or frequently reported levels, both of which draw great attention from the media and politicians. Given their historical volatility, it is difficult to read too much into any particular reading, but the trend lines can provide interesting information.
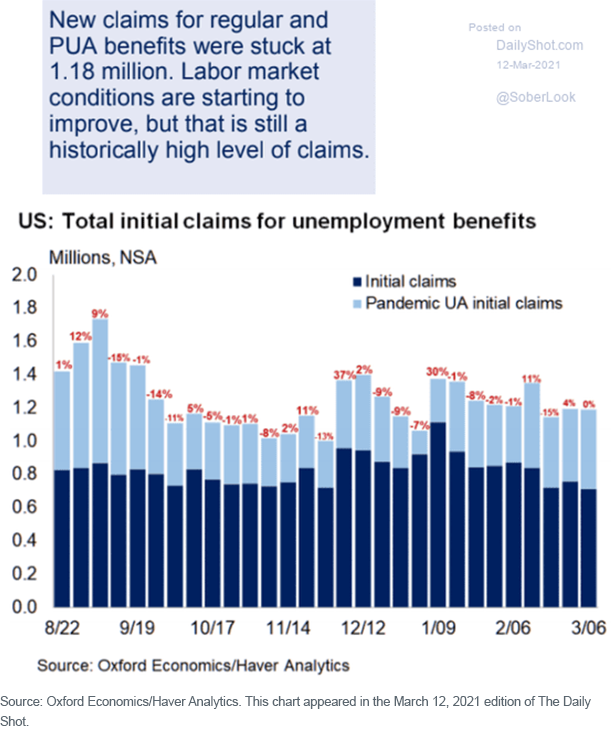
First is the weekly unemployment claims, a measure of how many new people are filing for unemployment each week. Despite the improving employment numbers, this metric has remained stubbornly between ~800K and 1.2 million claims per week for months:
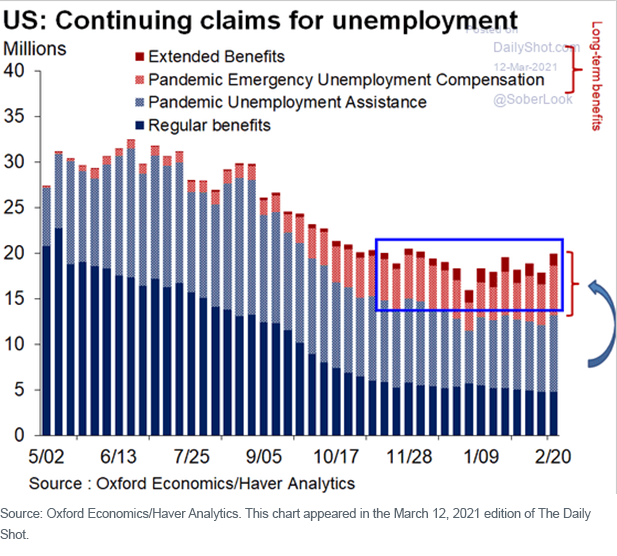
Likewise, the continuing unemployment claims number (unemployed workers who have not found jobs) remains stubbornly high. [Note: The light blue, pink and red shaded areas below are the data some politicians cite when arguing that extended pandemic relief benefits are one reason many workers are not looking to return to the workforce—they make more money from their benefits than from their previous job.
Conclusions
It is undeniable that unemployment is falling as the U.S. recovers from the COVID-19-induced recession, and that fall is likely to continue and perhaps even accelerate as the full impact of massive fiscal stimulus works its way through the economy.
But it is a spotty and uneven improvement that has focused primarily on the already affluent/well-educated working class. This is why worker and consumer sentiment surveys sometimes send mixed signals. We are in an economic recovery, but it doesn’t feel that way to many workers—especially those who continue to suffer from the ongoing lockdown and capacity restrictions in the restaurant, service, travel and hospitality industries.
Fiscal stimulus may put disposable income into the hands of consumers, catalyzing a transitional economic growth spurt. But it is important to remember that fiscal stimulus (which we will define as borrowing money from the future to finance economic activity today) simply “pulls consumption forward.” The risk is a “hangover” effect when the stimulus money has been spent on consumption and not on long-term capital investments in workers, R&D and tangible asset upgrades.
True and sustainable economic growth will come only when the economy is fully reopened (an in-sight target as COVID-19 vaccinations increase), benefiting all workers, and consumers once again are allowed to make individual and rational economic decisions.
Originally published by WisdomTree, 3/30/21
1 For more information on these two reports, please see https://www.bls.gov/web/empsit/ces_cps_trends.htm.
U.S. investors only: Click here to obtain a WisdomTree ETF prospectus which contains investment objectives, risks, charges, expenses, and other information; read and consider carefully before investing.
There are risks involved with investing, including possible loss of principal. Foreign investing involves currency, political and economic risk. Funds focusing on a single country, sector and/or funds that emphasize investments in smaller companies may experience greater price volatility. Investments in emerging markets, currency, fixed income and alternative investments include additional risks. Please see prospectus for discussion of risks.
Past performance is not indicative of future results. This material contains the opinions of the author, which are subject to change, and should not to be considered or interpreted as a recommendation to participate in any particular trading strategy, or deemed to be an offer or sale of any investment product and it should not be relied on as such. There is no guarantee that any strategies discussed will work under all market conditions. This material represents an assessment of the market environment at a specific time and is not intended to be a forecast of future events or a guarantee of future results. This material should not be relied upon as research or investment advice regarding any security in particular. The user of this information assumes the entire risk of any use made of the information provided herein. Neither WisdomTree nor its affiliates, nor Foreside Fund Services, LLC, or its affiliates provide tax or legal advice. Investors seeking tax or legal advice should consult their tax or legal advisor. Unless expressly stated otherwise the opinions, interpretations or findings expressed herein do not necessarily represent the views of WisdomTree or any of its affiliates.
The MSCI information may only be used for your internal use, may not be reproduced or re-disseminated in any form and may not be used as a basis for or component of any financial instruments or products or indexes. None of the MSCI information is intended to constitute investment advice or a recommendation to make (or refrain from making) any kind of investment decision and may not be relied on as such. Historical data and analysis should not be taken as an indication or guarantee of any future performance analysis, forecast or prediction. The MSCI information is provided on an “as is” basis and the user of this information assumes the entire risk of any use made of this information. MSCI, each of its affiliates and each entity involved in compiling, computing or creating any MSCI information (collectively, the “MSCI Parties”) expressly disclaims all warranties. With respect to this information, in no event shall any MSCI Party have any liability for any direct, indirect, special, incidental, punitive, consequential (including loss profits) or any other damages (www.msci.com)
Jonathan Steinberg, Jeremy Schwartz, Rick Harper, Christopher Gannatti, Bradley Krom, Tripp Zimmerman, Michael Barrer, Anita Rausch, Kevin Flanagan, Brendan Loftus, Joseph Tenaglia, Jeff Weniger, Matt Wagner, Alejandro Saltiel, Ryan Krystopowicz, Kara Marciscano, Jianing Wu and Brian Manby are registered representatives of Foreside Fund Services, LLC.
WisdomTree Funds are distributed by Foreside Fund Services, LLC, in the U.S. only.
You cannot invest directly in an index.
