
By John A. Forlines, III
Chief Investment Officer
The 2-year vs 10-year yield curve has inverted for the first time since 2019 (chart 1). This bond market phenomenon means the rate of the 2-year note is now higher than the 10-year note yield. Historically, when this curve inverts there has been a better than two-thirds chance of a recession at some point in the next year and a greater than 98% chance of a recession at some point in the next two years. So, should we start the countdown to recession?
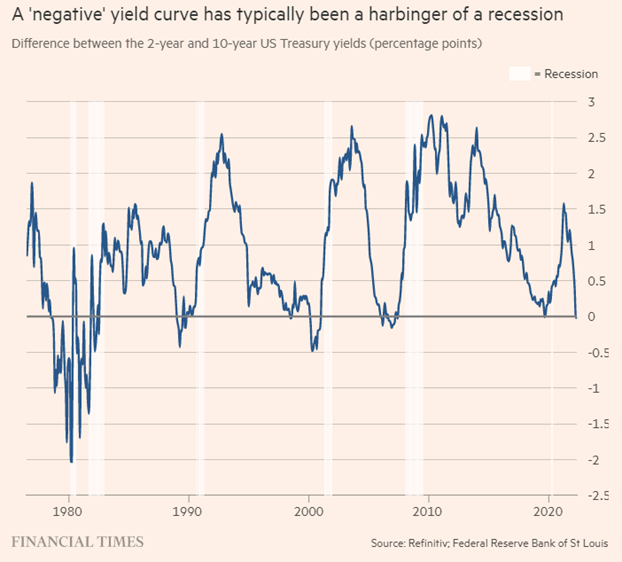
Chart 1 Source: Financial Times; from 1975-2022
First, we believe the financial media focuses too strongly on the 2s10s curve and a more comprehensive look at the treasury term structure is needed to add context. It is true recessions have always been predated by inverted yield curves, but not all inversions have led to recessions. Investors are rightfully concerned that inversions raise the probability of a recession, but recession alarms shouldn’t really start ringing when just one portion of the yield curve inverts. Instead, the odds of a recession rise as an increasing number of points in the yield curve invert. For instance, while 2s10s has inverted, the three-month vs 10-year curve is nowhere even close to inverted and was recently at its steepest level in five years. Historically, when just a few points of the yield curve invert, the probability of a recession only marginally increases. It isn’t until most points in the curve invert that a recession in the next two years becomes increasingly inevitable.
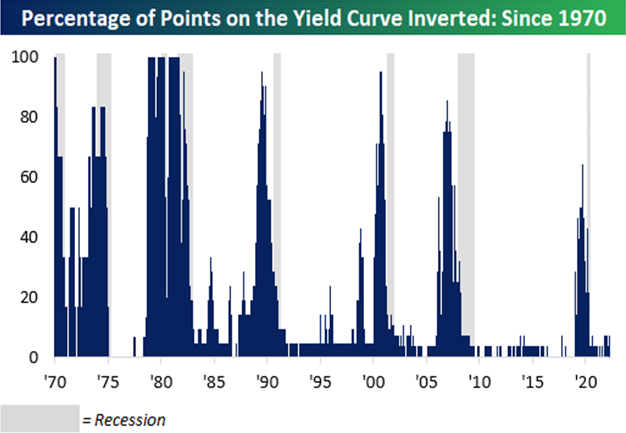
Chart 2 Source: Bespoke Investment Group
In chart 2, it shows all possible combinations of the constant maturity Treasury curve and calculated how many of those curve points were inverted on any given day going back to 1970. As you can see, the economy has gone into a recession in the two years following every point at which more than half of the points in the yield curve that inverted.
Based on historical trends, with just a few points in the yield curve inverted (7.1% of the points tracked), there’s little in the way of a recession warning.
And not all yield curves should be treated equally (chart 3). There are seven yield curves that, when inverted, have historically resulted in a recession at some point in the following two years 100% of the time, and all seven of those points on the curve remain relatively steep with a minimum spread of 93 bps and all the others at more than 200 bps. Looking ahead, we’ll need to see more points on the Treasury curve listed at the top of the table start to invert before fully expecting a recession.
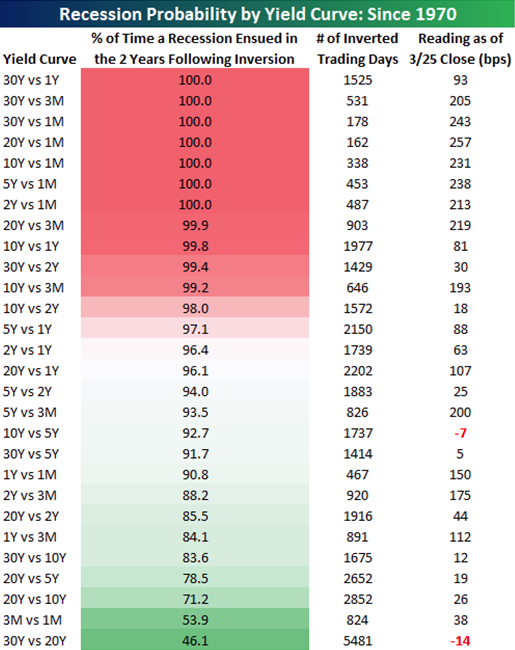
Chart 3 Source: Bespoke Investment Group, as of 3/25/22
And there are other factors that make this “signal” less meaningful. For one, the curve did not spend much time at all inverted and has already begun to steepen. And in general, we believe the bond markets signaling power has been weakened since the 2008 crash because of central bank intervention, regulatory pressure on banks, and liability-driven investors that hold bonds regardless of price or risk, like pension funds and insurers. The only example of 2s10s inversion since the QE era is 2019. And while that signal did prove correct, it was more like a broken clock being right than an accurate economic forecasting tool because of the policy induced recession brought on by the covid pandemic. Therefore, we must consider other factors like the strong job market, strong earnings, strong household and business spending, and a strong housing market.
Additionally, if the signal is correct, in chart 4, history shows us the previous four times the 2s10s yield curve inverted, the S&P 500 rallied for another 17 months and gained 28.8% until the ultimate peak. Therefore, panic selling into an inversion has never been a good idea. And in fact, this would mark the first time that the S&P 500 declined in the three months leading up to an inversion.
(Chart 4) Yield Curve Inversions Can Be Bullish for Stocks
2 YEAR / 10 YEAR YIELD CURVE INVERSIONS
| Date of Inversion | Bull Market Peak Date | S&P 500 Index Return | Months Til Bull Market Peak |
|---|---|---|---|
| 12/13/1988 | 07/16/1990 | 33.2% | 19.1 |
| 05/26/1998 | 03/24/2000 | 39.6% | 20.0 |
| 12/27/2005 | 10/09/2007 | 24.6% | 21.4 |
| 08/27/2019 | 02/19/2020 | 18.0% | 5.8 |
| Average | 28.8% | 17.1 | |
| Median | 28.9% | 20.2 |
Chart 4 Source: LPL Research, St. Louis Fed 03/30/2022 (Last Four Inversions)
All indexes are unmanaged and cannot be invested into directly. Past performance is no guarantee of future results.
In summary, we don’t believe the 2yr-10yr signal to be a golden rule of investing. The golden rule of investing is simple: don’t bet against stocks unless you think that there is a recession around the corner, because equities and bear markets tend to overlap. While the US may not be able to avoid a recession like it did during the 2010s expansion, an economic downturn is unlikely until 2024. Therefore, we re-affirm our positioning that the 2021 selloff in risk assets is a buying opportunity, especially with sentiment at recession level lows as seen in chart 5.
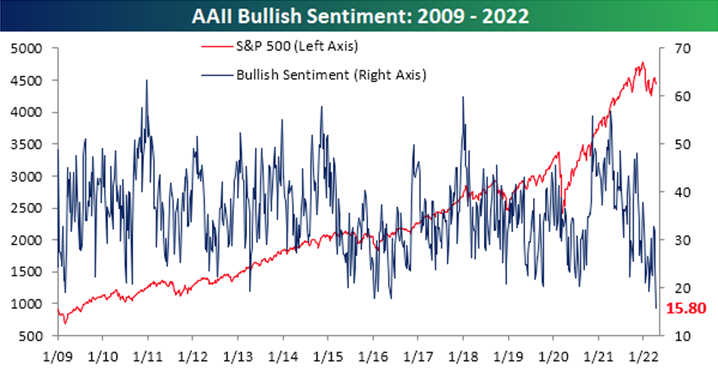
Chart 5
The coming investment environment is set to be defined by the Federal Reserve’s twin effort to raise interest rates and shrink its bloated balance sheet. Rate hikes began last month, and the latest Fed minutes suggest that quantitative tightening may be kicked off at its May 3-4 meeting. The nice thing about analyzing this twin tightening cycle is that the only time it has happened before was in the very recent past, and so the lessons should be relevant. Last time around, the Fed hiked interest rates from December 2015 to December 2018 and conducted QT from October 2017 to July 2019. While, the Fed will move at a faster pace to confront inflation than the last episode, there is a bigger liquidity buffer, and we expect a similar environment for assets. For the time being, we believe bond yields and inflation may be near a short-term peak and we believe equities will rise modestly over the next year.
Recent Portfolio Changes
No changes this month.
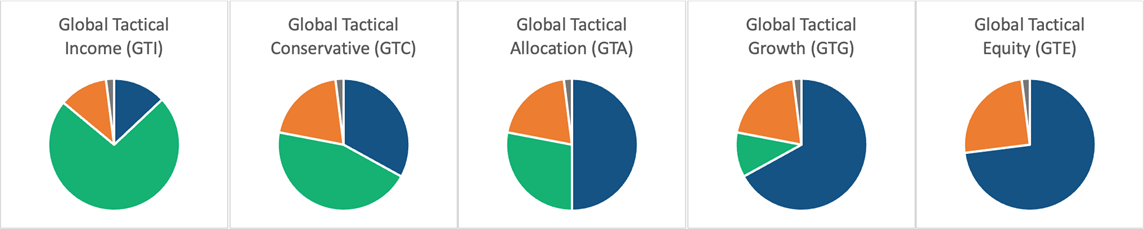
Allocations as of 03/10/2022
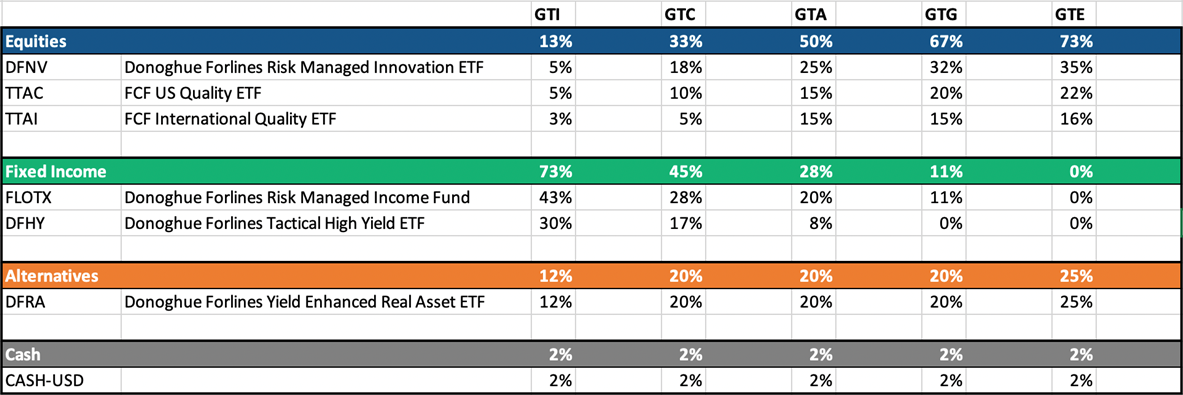
Holdings as of 03/10/2022
Past performance is no guarantee of future results. The material contained herein as well as any attachments is not an offer or solicitation for the purchase or sale of any financial instrument. It is presented only to provide information on investment strategies, opportunities and, on occasion, summary reviews on various portfolio performances. The investment descriptions and other information contained in this Markets in Motion are based on data calculated by Donoghue Forlines LLC and other sources including Morningstar Direct. This summary does not constitute an offer to sell or a solicitation of an offer to buy any securities and may not be relied upon in connection with any offer or sale of securities.
The views expressed are current as of the date of publication and are subject to change without notice. There can be no assurance that markets, sectors or regions will perform as expected. These views are not intended as investment, legal or tax advice. Investment advice should be customized to individual investors objectives and circumstances. Legal and tax advice should be sought from qualified attorneys and tax advisers as appropriate.
The Donoghue Forlines Global Tactical Allocation Portfolio composite was created July 1, 2009. The Donoghue Forlines Global Tactical Income Portfolio composite was created August 1, 2014. The Donoghue Forlines Global Tactical Growth Portfolio composite was created April 1, 2016. The Donoghue Forlines Global Tactical Conservative Portfolio composite was created January 1, 2018. The Donoghue Forlines Global Tactical Equity Portfolio composite was created January 1, 2018.
Results are based on fully discretionary accounts under management, including those accounts no longer with the firm. Individual portfolio returns are calculated monthly in U.S. dollars. These returns represent investors domiciled primarily in the United States. Past performance is not indicative of future results. Performance reflects the re-investment of dividends and other earnings.
Net returns are presented net of management fees and include the reinvestment of all income. Net of fee performance, when composite accounts are 100% non-fee paying, was calculated using a model fee of 1% representing an applicable wrap fee. The investment management fee schedule for the composite is: Client Assets = All Assets; Annual Fee % = 1.00%. Actual investment advisory fees incurred by clients may vary.
The Donoghue Forlines Global Tactical Allocation Benchmark is the HFRU Hedge Fund Composite. The Blended Benchmark Conservative is a benchmark comprised of 80% HFRU Hedge Fund Composite and 20% Bloomberg Barclays Global Aggregate, rebalanced monthly. The Blended Benchmark Growth is a benchmark comprised of 80% HFRU Hedge Fund Composite and 20% MSCI ACWI, rebalanced monthly. The Blended Benchmark Income is a benchmark comprised of 60% HFRU Hedge Fund Composite and 40% Bloomberg Barclays Global Aggregate, rebalanced monthly. The Blended Benchmark Equity is a benchmark comprised of 60% HFRU Hedge Fund Composite and 40% MSCI ACWI.
The MSCI ACWI Index is a free float adjusted market capitalization weighted index that is designed to measure the equity market performance of developed and emerging markets. The HFRU Hedge Fund Composite USD Index is designed to be representative of the overall composition of the UCITS-Compliant hedge fund universe. It is comprised of all eligible hedge fund strategies; including, but not limited to equity hedge, event driven, macro, and relative value arbitrage. The underlying constituents are equally weighted. The Bloomberg Barclays Global Aggregate Index is a flagship measure of global investment grade debt from twenty-four local currency markets. This multi-currency benchmark includes treasury, government-related, corporate and securitized fixed-rate bonds from both developed and emerging markets issuers.
Index performance results are unmanaged, do not reflect the deduction of transaction and custodial charges or a management fee, the incurrence of which would have the effect of decreasing indicated historical performance results. You cannot invest directly in an Index. Economic factors, market conditions and investment strategies will affect the performance of any portfolio, and there are no assurances that it will match or outperform any particular benchmark.
Policies for valuing portfolios, calculating performance, and preparing compliant presentations are available upon request. For a compliant presentation and/or the firm’s list of composite descriptions, please contact 800‐642‐4276 or [email protected].
Donoghue Forlines LLC is a registered investment adviser with the United States Securities and Exchange Commission in accordance with the Investment Advisers Act of 1940. Registration does not imply a certain level of skill or training.
