
Quarterly Comparisons Consistent Patterns
![]() One way to better understand the individual quarterly dispersions is to compare the individual quarters. The table below highlights the five biggest quarters of outperformance and underperformance versus the S&P 500:
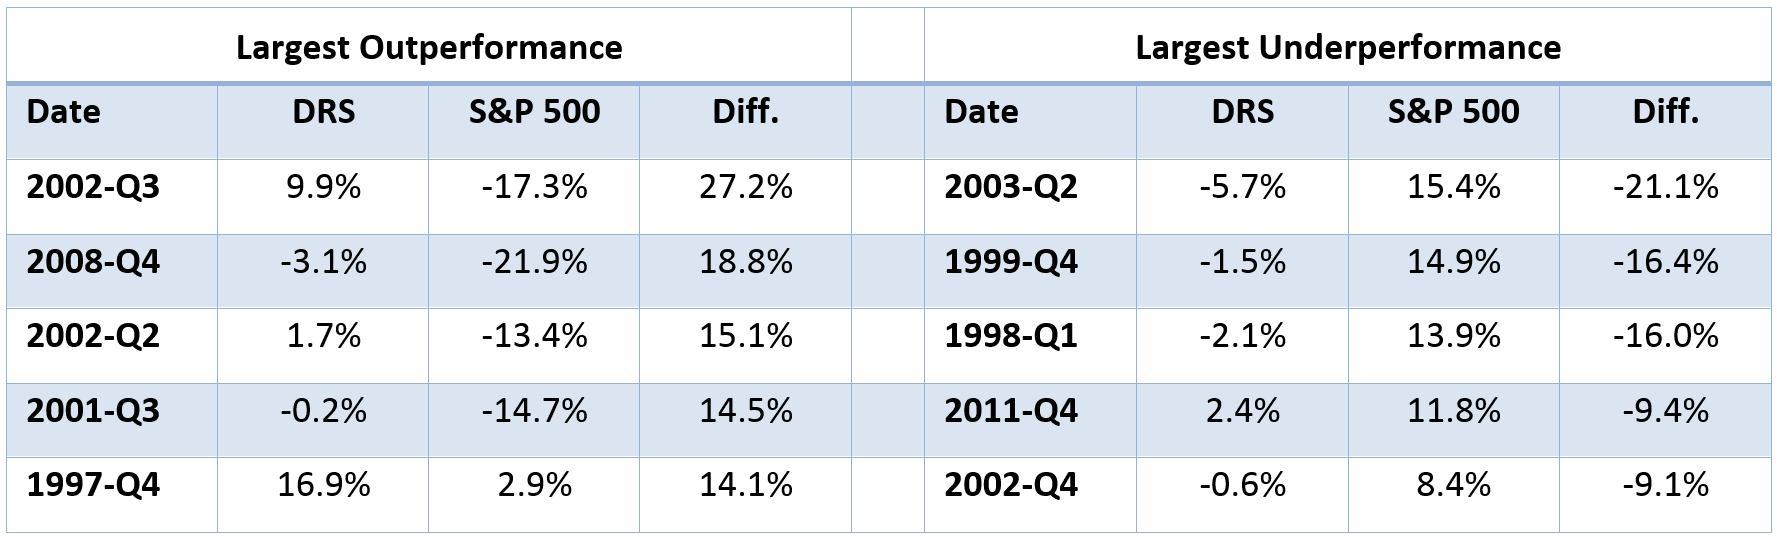
One way to better understand the individual quarterly dispersions is to compare the individual quarters. The table below highlights the five biggest quarters of outperformance and underperformance versus the S&P 500:
Source: Swan Global Investments
There are two primary takeaways from this table.
First, the periods of the greatest outperformance tend to happen during major, double-digit sell-offs and the largest underperformance tends to happen during large, double-digit rallies. Even though there are individual divergences, this pattern demonstrates that the DRS consistently performs the way it is intended.
Second, many of the periods of large dispersions happened early on in the DRS’s history. Eight of the ten biggest quarterly dispersions occurred within the first seven years of the DRS and none have occurred within the last five years. The DRS has evolved over the years with one of the goals being to reduce periods of huge dispersions, which it has been able to do.
Don’t Forget the Down Capture
The down captures are worth exploring in more detail because the context in which these capture ratios occurred sheds light on the results.
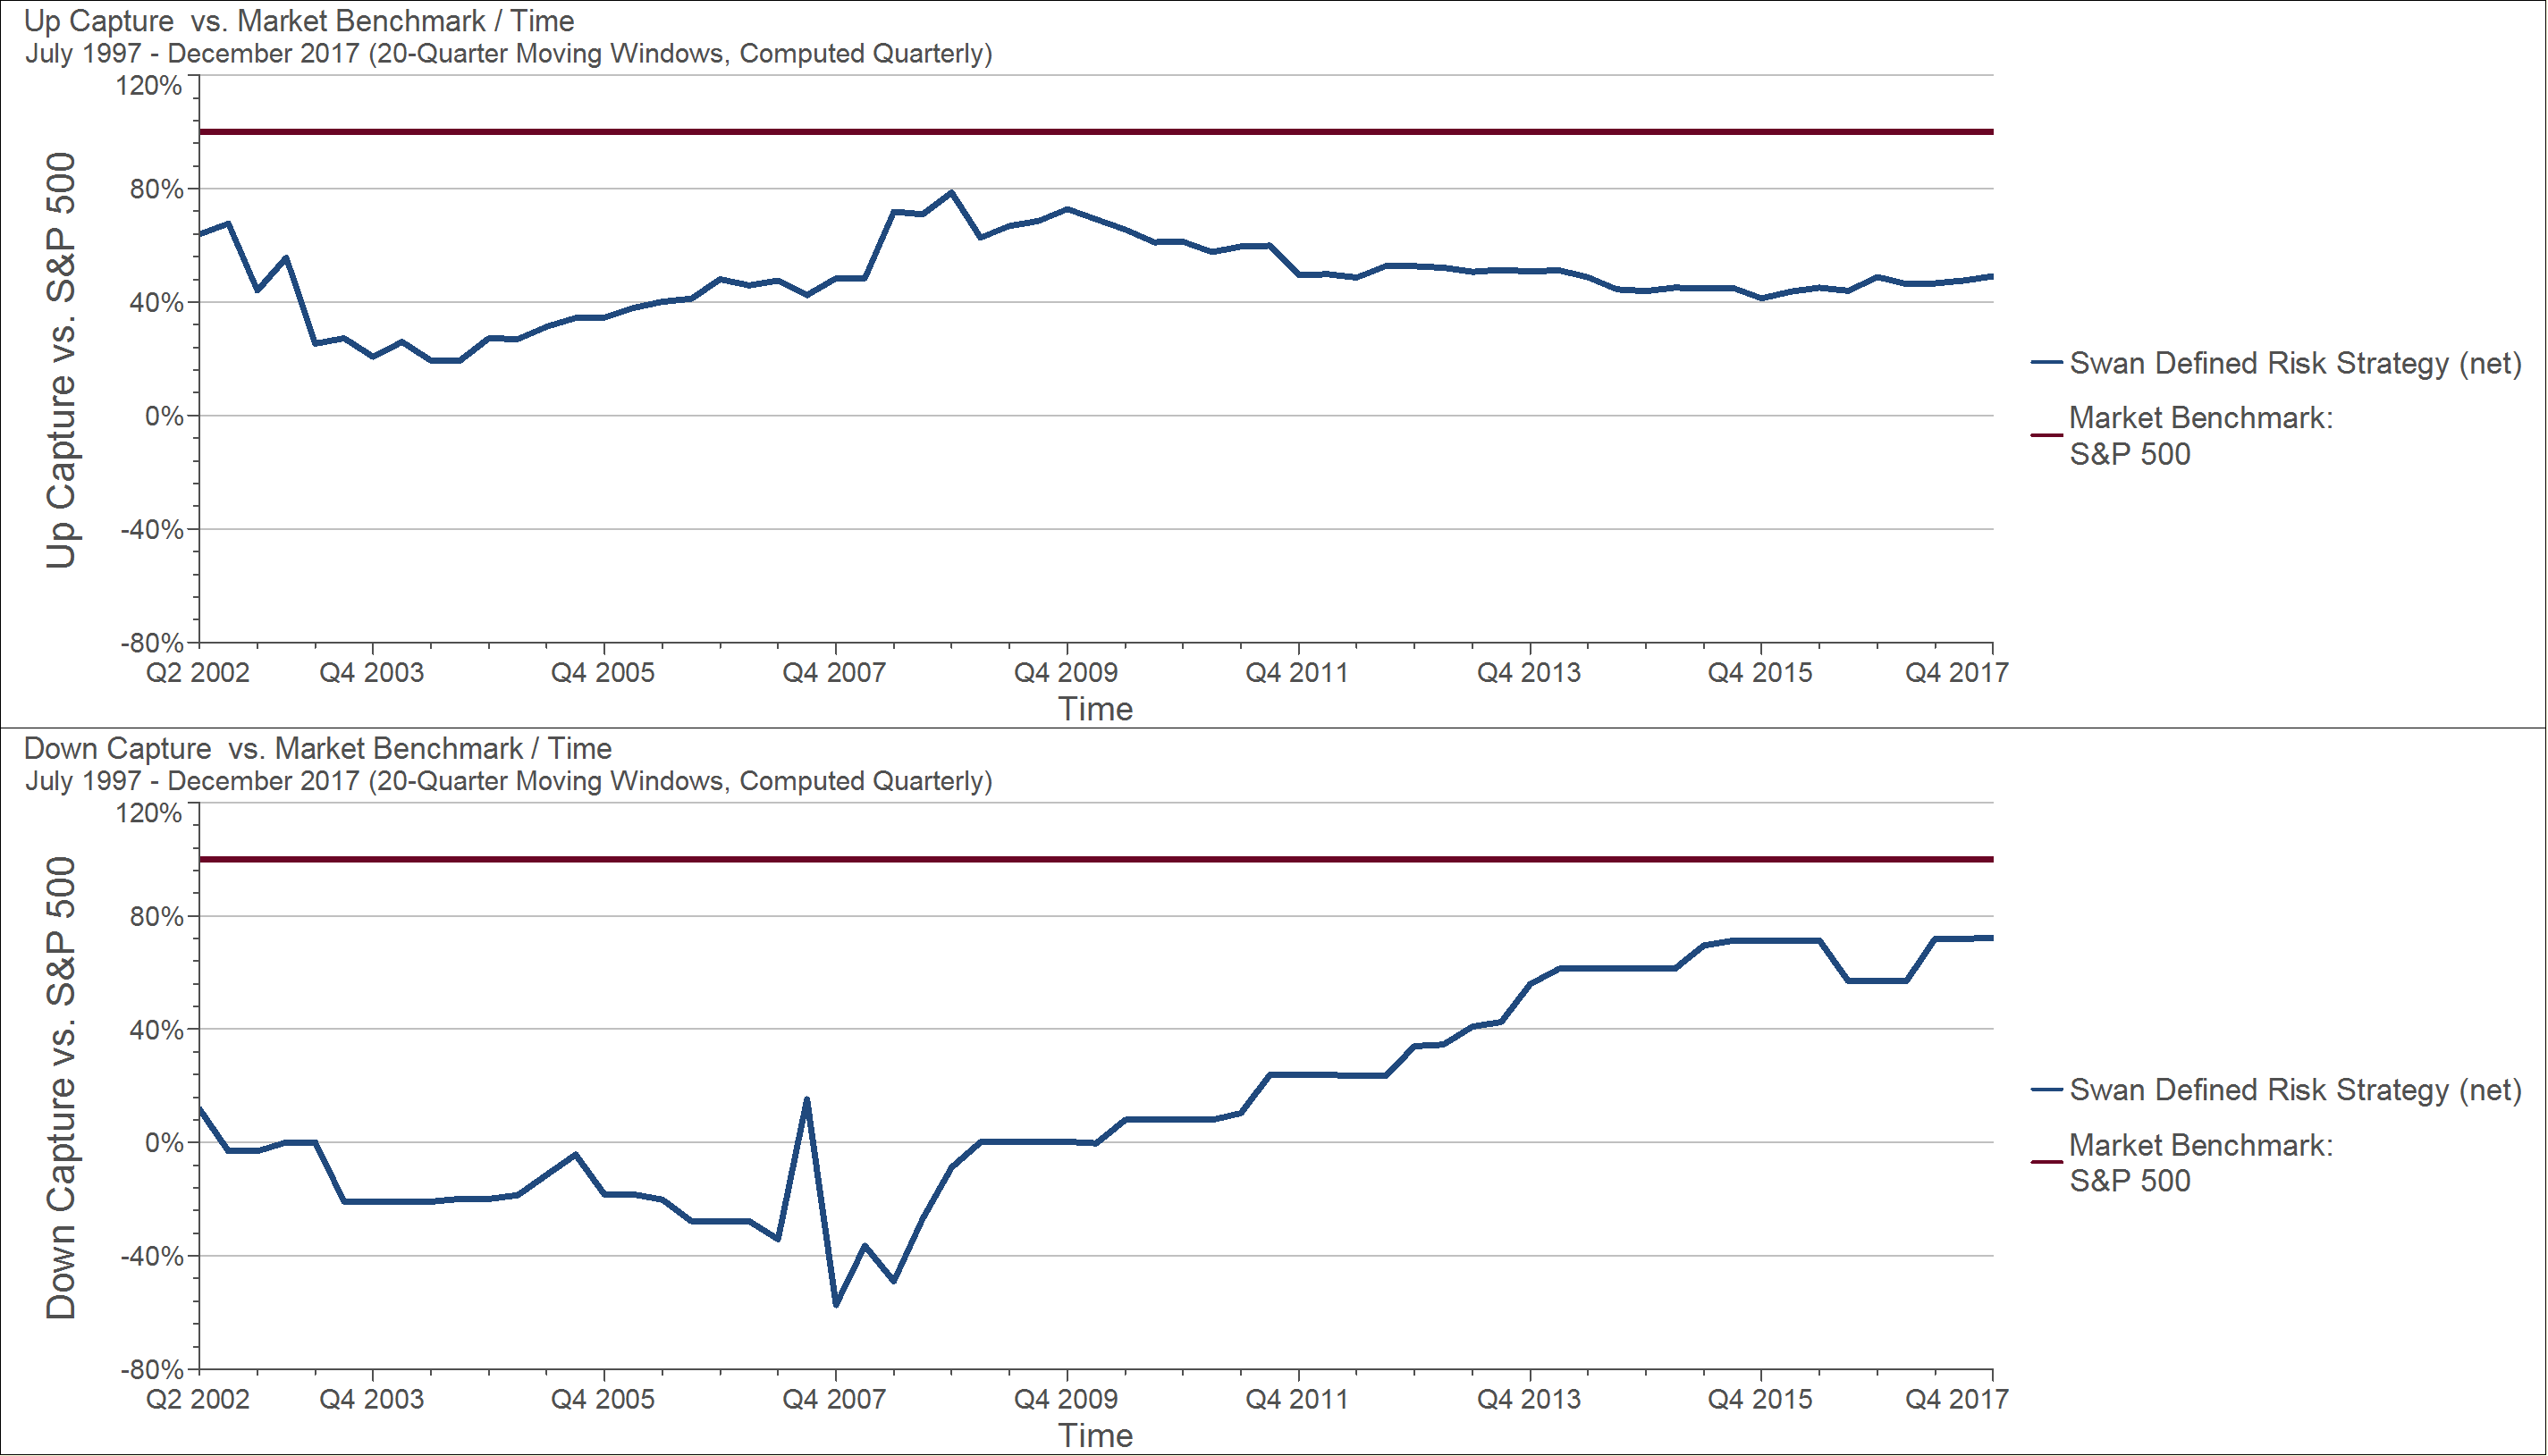
In the graphs below we see the rolling, five-year quarterly capture ratios, with up capture on the top and down capture on the bottom. You can see that on a rolling five-year basis the up captures range from 19.35% to 78.57% and the down captures range from -57.36% to 72.19%. It is important to remember that the lower the down capture, the better; a negative down capture indicates that the performance of the DRS was positive when the market was losing money.
Source: Zephyr StyleADVISOR, Swan Global Investments
The point when down capture was at its best was the five- year period ending December 2007. This span included the tail end of the dot-com crisis and the start of the Global Financial Crisis. The point of the worst down capture is the current five-year period, ending December 31st, 2017. At this point, the bull market is almost nine years old. Within the last five years, only one quarter out of 20, the third quarter of 2015, was negative. The down capture of 72.19% represents only one data point.
Focusing on the Long Game
In a way, this is a manifestation of the behavior of the DRS described in a previous blog post, “How Some Managers Walk the Line.” The DRS does not have a linear relationship with the market. The whole point of the DRS is to not track the market. This will inevitably lead to return patterns that are less driven by the S&P 500.
It is the goal of the DRS to produce a much more stable, predictable range of returns. This was discussed in depth in the blog post “The Importance and Value of a Non-Normal Distribution of Returns.” The trade-off for protection on the downside is giving up some of the upside. With a historic capture ratio of 52.5% on the upside and 13.0% on the downside, the DRS has achieved that. However, it is important to remember those ratios can and will fluctuate over shorter periods of time.
Marc Odo is the Director of Investment Solutions at Swan Global Investments, a participant in the ETF Strategist Channel.
