
By David Fajardo, SVP Marketing and Chief Content Officer for Direxion
Should traders be long, or beware?
The question all traders are asking is: Can the longest – and most hated- bull market in history continue to run?
For technical traders looking for entry and exit points, 50 and 200-day moving averages is just one, albeit, simplified approach. That said, it is worth noting that the S&P 500® is currently in rare air as it trades 3.12% above its 50-day moving average and 9.74% above its 200-day moving average even after lackluster performance this week. In fact, the recent range of the 200-day is the highest since January 2018 prior to the event immortalized by ‘Volmageddon’ on February 5 of that year.
This has been picked up by some in the trading community as an ominous sign even as equity and futures positioning looks a lot different today.
The S&P 500® is Trading Well above its Moving Averages
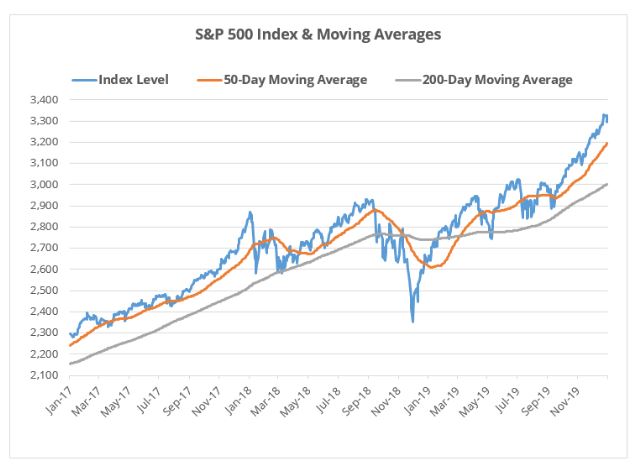
Source: Bloomberg Finance, L.P., as of January 24, 2020. Past performance is not indicative of future results. One cannot invest directly in an index.
Seeing the S&P trade that far above support lines may indeed indicate that a pullback is due, but a 3-year picture does not tell us much about the true opportunities for additional gains or, on the flipside, a sell-off.
Be that as it may, we looked at data back to the late 1920s in order to gauge how rare this air may actually be. As expected, we confirmed that the S&P is trading well above its 200-day moving average and the average of its moving average based on an extremely long time period.
The S&P 500® Bull May Have Room to Run

Source: Bloomberg Finance, L.P., as of January 24, 2020. Past performance is not indicative of future results. One cannot invest directly in an index.
This chart shows that the index does not need to fall back to those levels anytime soon and can continue at these levels for some time as witnessed for multiple month periods. It is also worth noting that the S&P had not seen a day of greater than plus or minus 1% in over 70 days until Monday, January 27.
Few Ever See the Big One Coming.
There are many traders and investors who will tell you that they saw the last big drawdown coming. The old saw about economists who called 10 of the last 5 recessions is a decade- old joke.
While there is no guarantee that this calm will continue as the Coronavirus outbreak in China could steamroll, do not simply rely on the fact that the market trading above moving averages to hunker for a selloff, but be prepared for the possibility that the next one could be sizable. It could also be short-lived given the considerably easy financial conditions in the U.S. and around the globe.
As a trader, whether you think you should be long, or beware, you can only win if you get the direction right. Trade boldly.
Related Leveraged ETFs
- Daily S&P 500 Bull 3X Shares (SPXL)
- Daily S&P 500 Bear 3X Shares (SPXS)
- Daily S&P 500® High Beta Bull 3X Shares ETF (HIBL)
- Daily S&P 500® High Beta Bear 3X Shares ETF (HIBS)
These leveraged ETFs seek investment results that are 300% of the return of its benchmark index for a single day. Investing in Leveraged ETFs may be more volatile than investing in broadly diversified funds. The use of leverage by an ETF increases the risk to the ETF. Leveraged ETFs are not suitable for all investors and should be utilized only by sophisticated investors who understand leverage risk, consequences of seeking daily leveraged, or daily inverse leveraged, investment results and intend to actively monitor and manage their investment. The ETFs seek to return a multiple of the benchmark indexes for a single day are not designed to track their respective underlying indices over a period of time longer than one day.
An investor should carefully consider a Fund’s investment objective, risks, charges, and expenses before investing. A Fund’s prospectus and summary prospectus contain this and other information about the Direxion Shares. To obtain a Fund’s prospectus and summary prospectus call 646-846-0181 or visit our website at www.direxion.com. A Fund’s prospectus and summary prospectus should be read carefully before investing.
Shares of the Direxion Shares are bought and sold at market price (not NAV) and are not individually redeemed from a Fund. Market Price returns are based upon the midpoint of the bid/ask spread at 4:00 pm EST (when NAV is normally calculated) and do not represent the returns you would receive if you traded shares at other times. Brokerage commissions will reduce returns. Fund returns assume that dividends and capital gains distributions have been reinvested in the Fund at NAV. Some performance results reflect expense reimbursements or recoupments and fee waivers in effect during certain periods shown. Absent these reimbursements or recoupments and fee waivers, results would have been less favorable.
The “S&P 500® High Beta Index” is a product of S&P Dow Jones Indices LLC (“SPDJI”), and has been licensed for use by Rafferty. Standard & Poor’s® and S&P® are registered trademarks of Standard & Poor’s Financial Services LLC (“S&P”); Dow Jones® is a registered trademark of Dow Jones Trademark Holdings LLC (“Dow Jones”); and these trademarks have been licensed for use by SPDJI and sublicensed for certain purposes by Rafferty. Rafferty’s ETFs are not sponsored, endorsed, sold or promoted by SPDJI, Dow Jones, S&P, or their respective affiliates and none of such parties make any representation regarding the advisability of investing in such product(s) nor do they have any liability for any errors, omissions, or interruptions of the S&P 500® High Beta Index.
Direxion Shares Risks – An investment in the ETFs involves risk, including the possible loss of principal. The ETFs are non-diversified and include risks associated with concentration that results from an ETF’s investments in a particular industry or sector which can increase volatility. The use of derivatives such as futures contracts and swaps are subject to market risks that may cause their price to fluctuate over time. The ETFs do not attempt to, and should not be expected to, provide returns which are a multiple of the return of their respective index for periods other than a single day. For other risks including leverage, correlation, daily compounding, market volatility and risks specific to an industry or sector, please read the prospectus.
Distributor for Direxion Shares: Foreside Fund Services, LLC.
