
The average person in America spends $1100/year on coffee – it’s probably higher if you count coffee at home.
That’s $11,000 spend over 10 years.
Let’s also assume you get a muffin or some other food so your spending on “other things at Starbucks” is also $1100/yr or $11,000 over 10 years
Let’s sum our likely spending up: $11,000 + $11,000 = $22,000 in spending
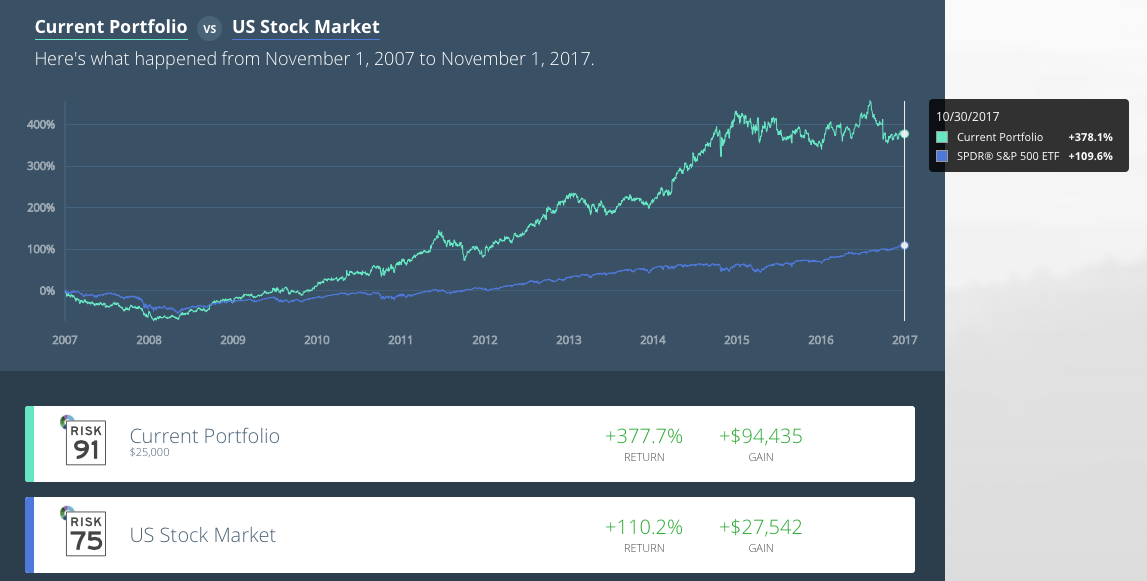
WHAT WOULD MY GAIN LOOK LIKE IF I SPENT $25K ON STARBUCKS STOCK 10 YEARS AGO ENDING 11/1/17?
![]() A MINISCULE 2.4X GAIN VS THE S&P 500, I PAID FOR MY SPENDING HABITS IN GAINS AND LOTS AND LOTS OF MONEY LEFT OVER FOR RETIREMENT GOALS!
A MINISCULE 2.4X GAIN VS THE S&P 500, I PAID FOR MY SPENDING HABITS IN GAINS AND LOTS AND LOTS OF MONEY LEFT OVER FOR RETIREMENT GOALS!
BOTTOM LINE:
Obviously every brand would not have offered out-performance versus the S&P 500 but even the worst performer of the 20, Chevron offered a gain of roughly $21,600. That doesn’t include the further gains generated if those dividends were reinvested along the way.
But my Chevron gains would certainly take the edge off of my high gas spending over time. At the very least, the gains lower the average cost of gas which is always welcomed!
Let’s not forget about inflation too. Inflation is a silent tax most of the time. It does, however drain purchasing power. Our government does a wonderful job carving out the rising costs of everything we really need and tells us there’s no inflation but investing in stocks, particularly stocks with pricing power, strong moats around their business and those focused on an enormous and persistent theme of consumption, aka BRANDS can absolutely be a nice hedge against inflation over time. Something to ponder as you do your holiday shopping. Perhaps you should add some of your favorite Brands to the portfolio as a spending hedge?
Happy holidays from all of us at Accuvest Global Advisors.
Disclosures
Accuvest Global Advisors (“Accuvest”) is a registered investment adviser with the Securities and Exchange Commission. Accuvest and its affiliates do not provide tax advice. Accordingly, any discussion of U.S. tax matters contained herein (including any attachments) is not intended or written to be used, and cannot be used, in connection with the promotion, marketing or recommendation by anyone unaffiliated with Accuvest of any of the matters addressed herein or for the purpose of avoiding U.S. tax-related penalties. The information provided by Accuvest (or any portion thereof) may not be copied or distributed without Accuvest’s prior written approval. All statements are current as of the date written and does not constitute an offer or solicitation to any person in any jurisdiction in which such offer or solicitation is not authorized or to any person to whom it would be unlawful to make such offer or solicitation. This information was produced by and the opinions expressed are those of Accuvest as of the date of writing and are subject to change. Any research is based on proprietary research and analysis of global markets and investing.
Hypothetical or Back-Tested Results
Any hypothetical or back-tested results were not actually achieved in a real account, nor can they be used as an expectation of future results, and are no guarantee losses will not occur in the future. No representation is being made that any account will or is likely to achieve profits of losses similar to these being shown. You should not assume investment decisions we will make in the future will be profitable or will equal the hypothetical investment performance of the past. The back test is limited in that it does not factor in costs such as brokerage commissions, taxes, slippage, spreads, and advisory fees. Back tested performance does not represent actual performance and should not be interpreted as an indication of such performance. Actual performance for client accounts may be materially lower than that of the portfolios. Back tested performance results have certain inherent limitations. Such results do not represent the impact that material economic and market factors might have on an investment adviser’s decision-making process if the adviser were actually managing client money. Back tested performance also differs from actual performance because it is achieved through the retroactive application of model portfolios designed with the benefit of hindsight. As a result, the models theoretically may be changed from time to time and the effect on performance results could be either favorable or unfavorable.
This article was written by Eric M. Clark, Portfolio Manager – Brands suite of investments at Accuvest, a participant in the ETF Strategist Channel.
Research/Outlook Disclosure
This information was produced by and the opinions expressed are those of Accuvest as of the date of writing and are subject to change. Any research is based on Accuvest proprietary research and analysis of global markets and investing. The information and/or analysis presented have been compiled or arrived at from sources believed to be reliable, however Accuvest does not make any representation as their accuracy or completeness and does not accept liability for any loss arising from the use hereof. Some internally generated information may be considered theoretical in nature and is subject to inherent limitations associated therein. Any sectors or allocations referenced may or may not be represented in portfolios of clients of Accuvest, and do not represent all of the securities purchased, sold or recommended for client accounts.
The reader should not assume that any investments in sectors and markets identified or described were or will be profitable. Investing entails risks, including possible loss of principal. The use of tools cannot guarantee performance. Past performance is no guarantee of future results. The information provided may contain projections or other forward-looking statements regarding future events, targets or expectations, and is only current as of the date indicated. There is no assurance that such events or targets will be achieved, and may be significantly different than that shown here. The information presented, including statements concerning financial market trends, is based on current market conditions, which will fluctuate and may be superseded by subsequent market events or for other reasons.
The charts depicted within this presentation are for illustrative purposes only and are not indicative of future performance. The data do not reflect the material differences between stocks, bonds, bills and inflation, such as fees (including sales and management fees), expenses or tax consequences. Common stocks generally provide an opportunity for more capital appreciation than fixed income investments but are also subject to greater market fluctuations.
Market indexes are included in this report only as context reflecting general market results during the period. Accuvest may trade in securities that are not represented by such market indexes and may have concentrations in a number of securities and in asset classes not included in such indexes. Accordingly, no representations are made that the performance or volatility of the model allocations will track or reflect any particular index. Market index performance calculations are gross of management and performance incentive fees. Investors cannot directly invest in an index. Actual results may vary based on an investor’s investment objectives and portfolio holdings. Investors may need to seek guidance from their legal and/or tax advisor before investing.
