
By Gustavo Medeiros of Ashmore Group
Believe it or not, Emerging Markets (EM) local currency bonds have been outperforming global fixed income asset classes for the past 18-months. Most of the outperformance has been based on an early and more appropriate hiking cycle from EM central banks, who are cutting rates ahead of developed market (DM) central banks.
EM currencies are attractive, and their fundamentals have improved due to structural reform and diversification away from China. On the other side of the coin, the Dollar fundamentals are very poor, and several factors suggest that last year bull trap marked the peak of this USD cycle. If confirmed, it would be only the third major peak in 50 years.
The piece also considers the impact of a weaker US Dollar in other EM asset classes.
1. EM Central Banks Ahead of the Curve
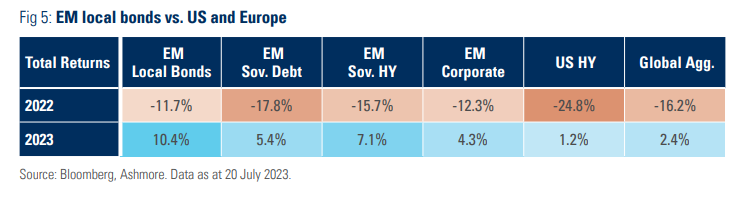
Investors are being forced to understand the dynamics of EM LC bonds again. EM LC is the best performing major fixed income asset classe since the beginning of 2022 and surged more than 10% year-to-date while the Bloomberg Global Aggregate is up less than 2% over the same period.
The main driver to the asset class dynamic is simple. Instead of labelling inflation as ‘transitory’ by comparing it with the 1985-2020 inflationary dynamics, EM central bankers understood early that inflation was likely to rise due to both supply shortages and excessive demand from fiscal stimulus. As a result, Brazil and Russia started hiking policy rates in Q1 2021, several quarters before US policymakers started calling inflation transitory.
Brazil went on to hike its policy rates to 13.75%, resulting in fast disinflation despite the large fiscal stimulus granted by the Brazilian government in 2020 and 2021. Inflation in Brazil has converged to the same level as the United States (US) for only the fourth time since 1995.
Other EM central banks followed shortly with Mexico, Poland and South Africa hiking policy rates already in 2021, and Indonesia and Malaysia hiking rates in 2022, as per Fig 1. The chart shows that Poland (and Eastern Europe in general) was the exception to the rule, postponing hikes despite a spike in inflation, but all the same it started its tightening cycle way ahead of the European Central Bank (ECB). In Asia, inflation and inflation expectations did not surge like in other regions of the world, allowing for a more moderate policy response.
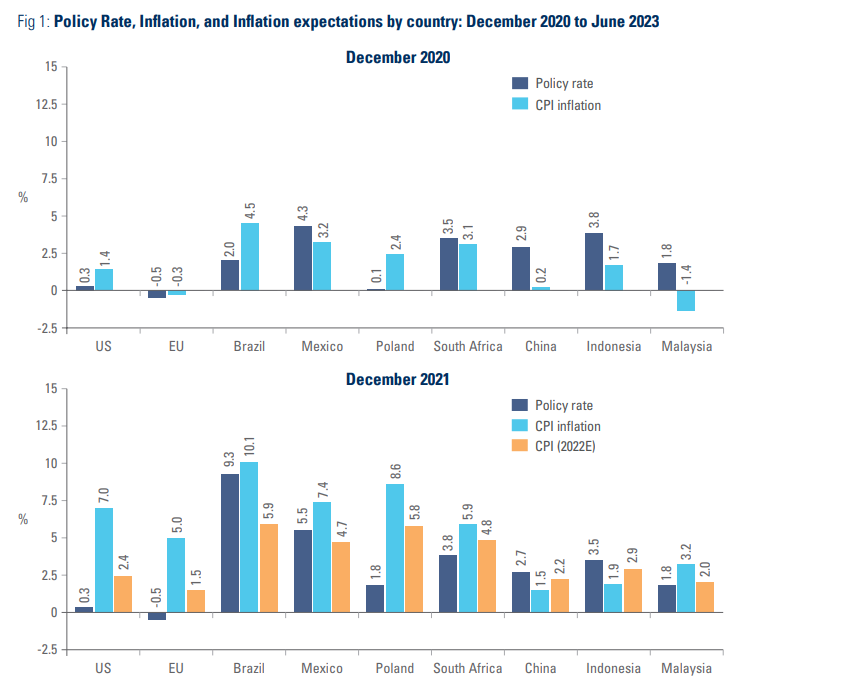
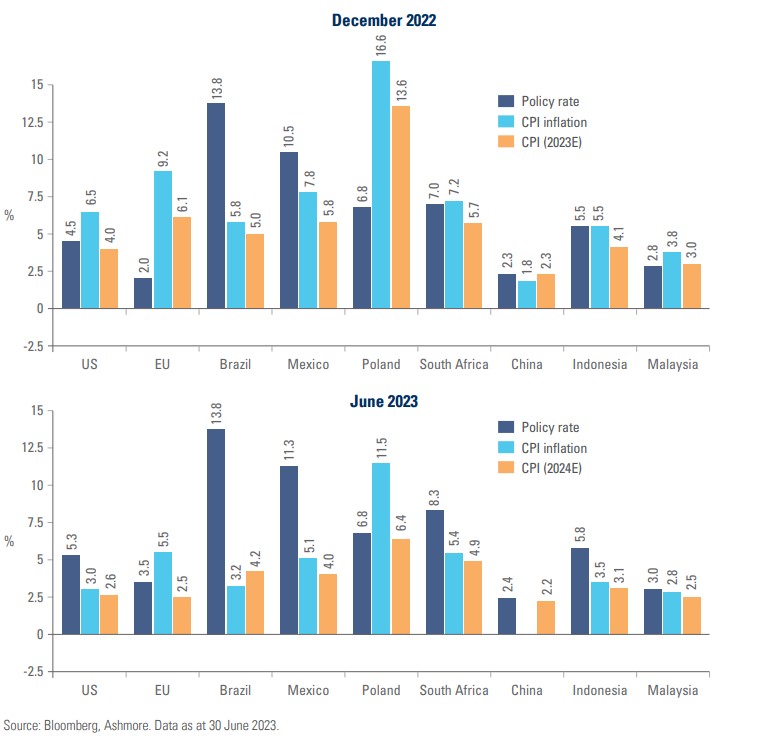
Fig 2 shows the policy rates, consumer price index (CPI) inflation and inflation expectations for 2023 and 2024, weighted by the LC bond benchmark, the JP Morgan Global Bond Index – Emerging Markets – Global Diversified (GBI EM GD). On average, EM central banks kept policy rates ahead of next year’s inflation expectations, an appropriate monetary policy approach designed to avoid the first impulse of higher prices turning into an inflationary spiral. Today’s policy rates are above current inflation, which is far above inflation expectations 18 months ahead. Thus we believe, EM central banks have a lot of room to cut policy rates over the coming quarters.
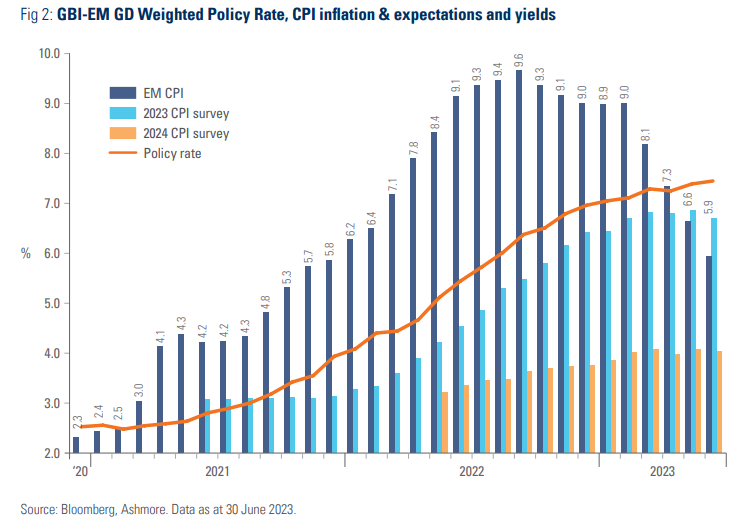
In fact, data from Bank of America Merrill Lynch shows EM central banks have, in net terms, stopped hiking policy rates and will be leading the monetary easing cycle on a forward-looking basis, as depicted by Fig 3:
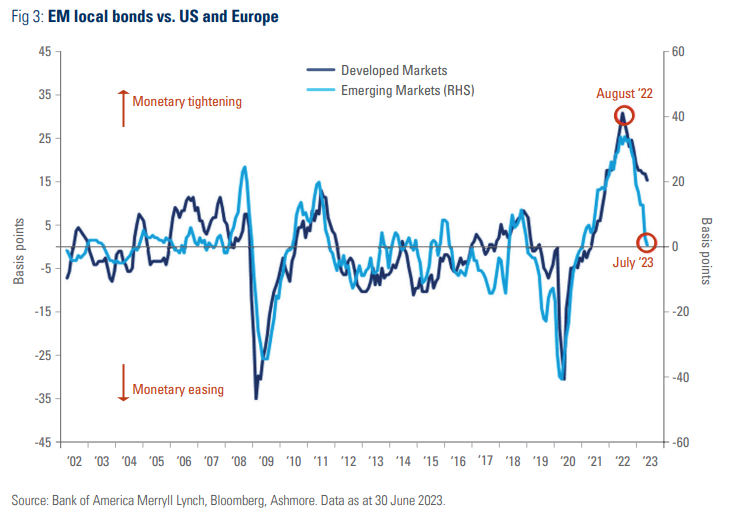
The pre-emptive monetary policy response explains why the yield on EM local bonds peaked in October 2022, while yields in Developed Markets (DM) came back to their highest levels again in June 2023. EM rates peaked just one month after peak inflation, as investors are more confident EM policymakers will start their easing cycle before DM. China and Vietnam, for example, are already cutting policy rates. Several other countries will, in our view, follow, including Chile, Brazil, Colombia, Peru, Poland, Romania, Czechia, Hungary, and South Africa. Mexico is likely to tune its policy closer to the US than Latin America. Among Asian countries, Philippines, Indonesia, and India may be the first to turn dovish, but most likely policy cuts will only come in 2024. Furthermore, EM interest rates have been much less volatile and have moved closer to their last five-ten year range than in DM, leading to lower risk of a credit crunch.
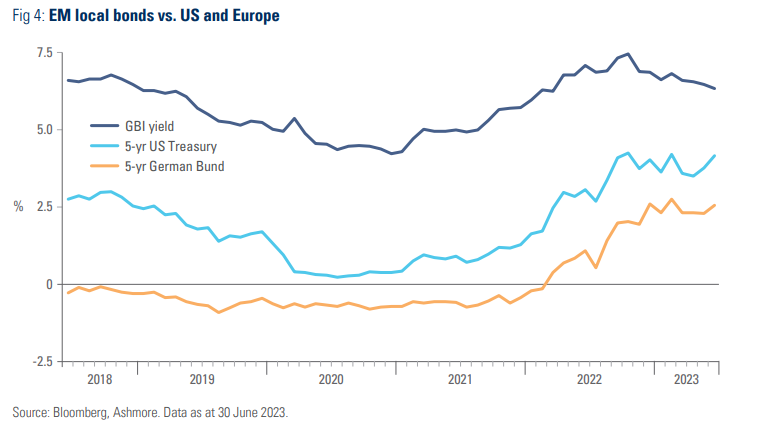
Lower bond yields alongside the beginning of the recovery in EM currencies explains why EM local bonds were the best-performing fixed income asset class across both EM and DM, as highlighted in Fig 4. EM local bonds started outperforming global fixed income assets in 2022, when fixed income assets were struggling with the aggressive policy rate increases by DM central banks:
2. Fundamentals: Which EM Countries Are Regaining RTheir Reform Motto?
Several EM countries are benefiting from economic reforms that are leading to improved country-level fundamentals. Other countries are benefiting from lower geopolitical risks than their DM peers and supply chain diversification from China. Some are benefiting from both. Some of the most interesting reform stories are Indonesia and India in Asia, and Brazil in Latin America.
Indonesia presents a case study of policy flexibility and orthodoxy. Authorities adopted an aggressive monetary policy and some fiscal stimulus during the pandemic but started consolidating their fiscal deficits early and have delivered consistent results. The fiscal deficit may close 2023 below 1.5% of gross domestic product (GDP), down from 6.1% in 2020, 4.5% in 2021 and 2.3% in 2022, according to the International Monetary Fund (IMF). At the same time, Indonesia continued to deliver on structural reforms that started in 2015. The long list includes the omnibus law (labour market), tax reforms and investment policy reforms. Indonesia’s government is making notable strides on its long-standing plan to better monetise commodity resources by building local supply chains to generate higher value-added exports, a strategy that led to significant investment announcement on the electric vehicle sector. The tax bill signed in October 2021 increased taxes, boosted revenues via an amnesty on undeclared capital, and introduced a new carbon tax, resulting in a steadfast fiscal consolidation.
Brazil had a more tortuous path. President Jair Bolsonaro initially maintained the reformist path adopted by his predecessor, Michel Temer, approving a long-coveted social security reform, central bank independency, labour market reform, promoting privatisations and several other measures that improved business conditions. Nevertheless, the Covid-19 crisis unveiled the worse side of the administration, including healthcare policies not recommended by public health experts. Bolsonaro’s cynical environmental policies made Brazil an environmental pariah. Lastly, after adopting only a gradual fiscal consolidation in 2019 and enacting a large (perhaps justified) fiscal stimulus during the pandemic, Bolsonaro adopted a populist budget in 2022, likely to boost his low popularity ahead of elections in October 2022. Newly elected, President Lula had to conciliate his populist agenda with fiscal consolidation; a tall order for a president anxious to improve people’s lives. Lula’s alliance with pragmatist politicians moderated his fiscal stance. Congress passed a fiscal consolidation framework and a landmark tax reform – key to simplifying Brazil’s taxation and improving the ease of doing business.1 Lula’s government aims to achieve a balanced primary budget in 2023, which, if successful, would be the first since 2013. At the same time, the government will position Brazil to regain its position as a global environmental powerhouse by tightening the restrictions on illegal forest deforestation and improving the incentives for renewable energy.
India has benefited from monetary and fiscal structural reforms as well as the digitalisation of a public database that allowed for a massive increase in its digital economy. When combined with its massively positive demographics profile, and its large strides towards energy transition, it makes India one of the most attractive investment destinations in the world.2
On top of that, India is one of the countries benefiting the most from the diversification of supply chains away from China. Other countries also benefiting include Thailand and Malaysia, both of which have their own idiosyncratic dynamics (Malaysia implementing a fiscal consolidation and Thailand benefiting from the Chinese reopening) and attractive asset prices.3 Vietnam, Philippines and Singapore should also be mentioned as beneficiaries of the supply chain diversification trend. So should Mexico who is attracting foreign direct investments while massively benefiting from the US excessive fiscal stimulus during the pandemic that allowed for a record level of remittances from US-based service sector workers to their Mexican families.
3. Valuations and Technicals
Fundamentals are improving and central banks are ahead of the curve (as per Fig 2), which suggests the returns for EM bonds in LC terms should remain attractive. The cherry on the cake (or the make-or-break moment for foreign investors) is the potential for EM currencies to appreciate from here. Valuations and technicals support the case for a multi-year currency appreciation.
A) Valuations
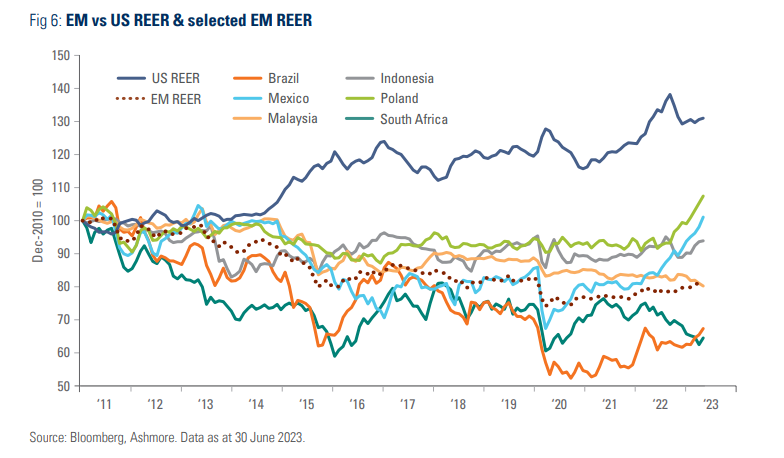
One of the best medium to long-term gauges for currency valuations is the real effective exchange rate (REER), or the currency of each country adjusted for inflation differentials against its main trading partners (it is not useful for trading signals but provides a long-term valuation metric). The REER analysis on Fig 6 shows EM currencies are trading at a 20% discount to December 2010 levels, whereas the US Dollar trades at a 30% premium over the same period.
A breakdown by key countries in the EM LC market shows some divergence. The Brazilian Real and South African Rand are undervalued vs. the average EM currency. Malaysian Ringgit valuations are in line with EM, Indonesia is c. 15% above EM REER, but still 6% below the levels of 2010. The Mexican Peso recently rose slightly above the 2010 level while the Polish Zloty is the highest-priced currency in the sample, 10% above 2010 levels.
However, the Zloty reflects higher valuations against the EUR, mostly because of higher interest rates in Poland and the fact that its central bank is likely to cut its policy rate in the second half of this year, while the ECB is still in a hiking cycle. Higher Polish inflation than in Europe since March 2019 also explains the higher REER. Finally, there is a distinct possibility of a pro-European coalition returning to power in general elections to be held between 15 October and 11 November. Vote intentions for the right-wing Law and Justice Party are hovering around 34% today, 10% lower than its performance in the previous election.
A key question for the longevity of the potential currency appreciation trend in EM is whether inflation differentials against the US (and DM in general) will resume the declining trend that prevailed from 2015 to 2022. The recent increase in the EM-US inflation gap was attributed to faster disinflation in US than in EM, mostly related to Eastern Europe and a few Latin American countries (such as Colombia and Mexico). Should inflation differentials converge to around 1%, instead of the average of the last 20 years of 2%, EM currencies could strengthen more before they start becoming ‘expensive’ and attract capital outflows.
B) Technicals
It is well known that the ownership of LC bonds by foreign investors has declined since March 2013, albeit at different speeds across the different regions and countries, as per Fig 7. China was the exception from 2016 to 2022, but recently foreign investors began to sell Chinese Government Bonds (CGB) as well, despite the massive outperformance of CGB against DM bonds over the last few years.
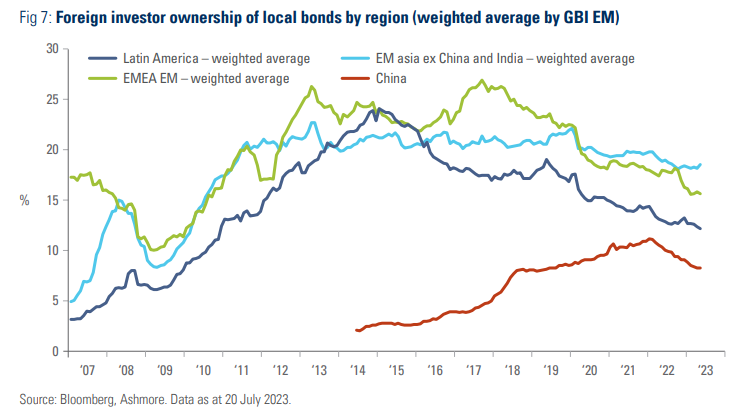
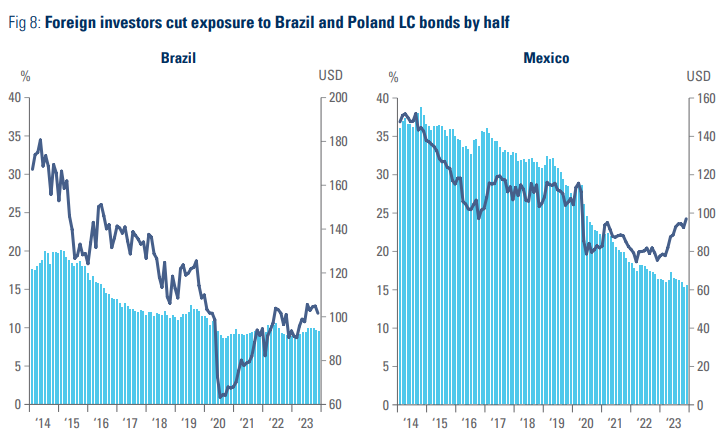
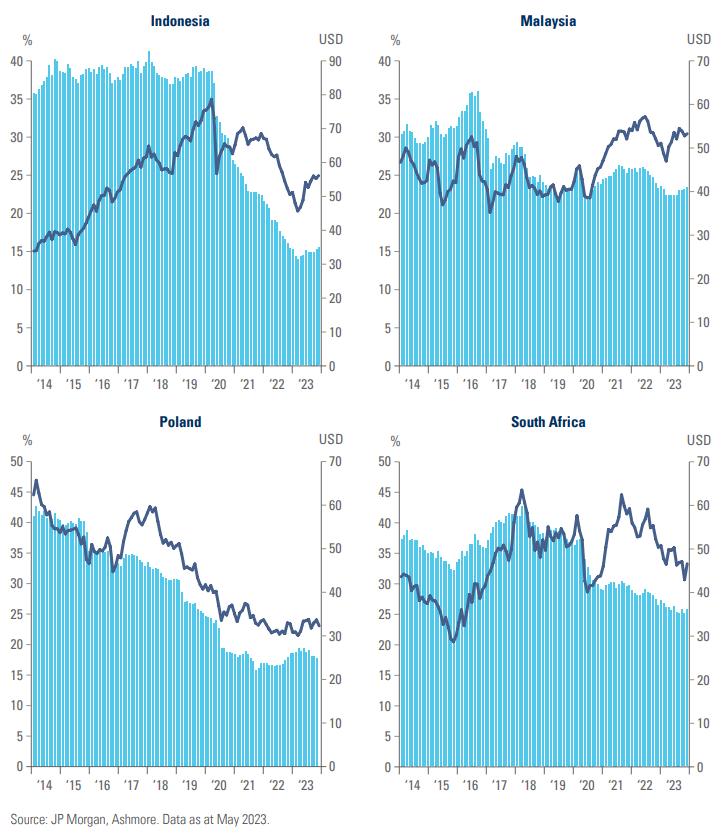
There are some nuances when looking into the data on a country-by-country basis and breaking down the foreign ownership of LC bonds in USD terms (Fig 8). Foreign investors started to add exposure to Brazil in March 2020, and to Mexico, Indonesia, and Malaysia in 2022, but are still selling South African local bonds which had a much larger foreign investor ownership than most EM countries until 2020. However, the big picture remains the same. Foreign investors cut their USD exposure to Brazil and Poland LC bonds by half and to Mexico and Indonesia by one-third but kept their exposure in USD terms relatively unchanged in Malaysia. The exodus from Indonesia justifies Bank Indonesia government bond purchases.
We have been highlighting for some time now that EM currencies are undervalued and the main catalyst that will drive EM foreign currencies (EMFX) up would be the beginning of the decline of the US Dollar. This is exactly how things are playing out, so far. Will the USD downturn that started in Q3 2022 continue? What are the technical and fundamental considerations underpinning our views?
4. The Dollar: Technicals
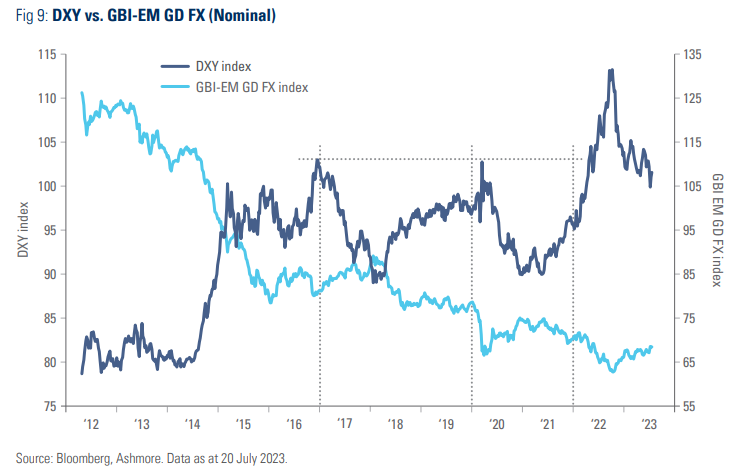
The last two occasions when the Dollar Index turned lower (in 2016 and 2020) didn’t lead to a long-term reversal of trend, but a choppy trading range where the Dollar Index was stuck between 90 and 104. In technical terms, Fig 9 shows the USD peaked last year after the Dollar Index broke a key resistance level at 104 and surged to 114 levels before plunging back below 104. Technical analysists call this dynamic (a fast rally after a key resistance-breaking, followed by a fast sell-off) a bull trap. Bull traps are important, in technical terms, because they often signal the end of a cycle and a long-term reversal of an asset.
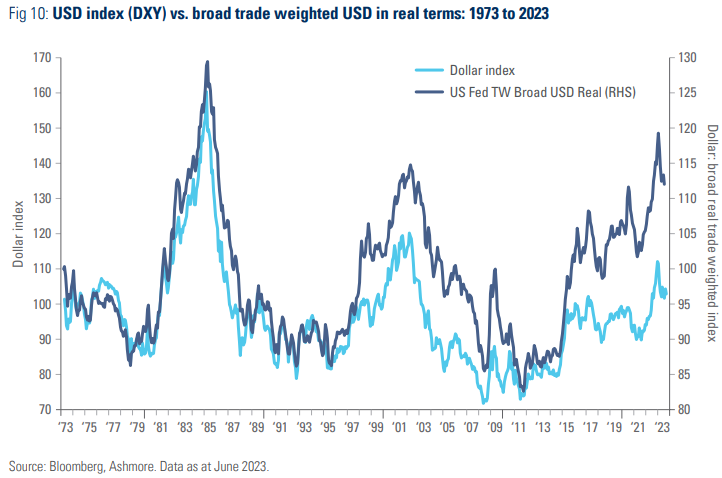
A longer-term perspective shows the USD peak last year was, in real term levels, only 10% below the 1985 ‘Plaza Accord’ top, when the Finance Ministers from France, Germany, the US, UK, and Japan agreed on a coordinated devaluation of the USD against the Japanese Yen and the Deutsche Mark. The other major USD peak was close to the top of the dot-com bubble in 2002. Fig 10 shows three major peaks in 50 years standing 20 years apart. The USD depreciation cycle that started in 2022 may well last for ten years, just like the March 1985 to June 1995 and the March 2002 to June 2011 periods.
5. The End of Dollar Hegemony? Maybe…
There is no need for such a grandiose title to make a very simple case that the US Dollar is overvalued, in our view. Americans visiting Paris and London find most things cheap while Europeans are awe-struck by the prices in America.
What has been holding the USD up are capital flows from foreign investors to the US equity markets, which have been outperforming the rest of the world over the last decade or so, and lack of diversification from US investors. The US equity market outperformance from 2009-2016 was justified by low valuations and better post-2008 policies (such as bank recapitalization). Nevertheless, we make the case that since 2017, the exceptional US stock market was driven – from a macro perspective – by extraordinary and pro-cyclical fiscal expansions that are unsustainable. So far in 2023, US equities have returned to the exceptionalism pattern that prevailed from 2011 to 2021, due to excessive and unsustainable pro-cyclical fiscal stimulus policy, in our view.
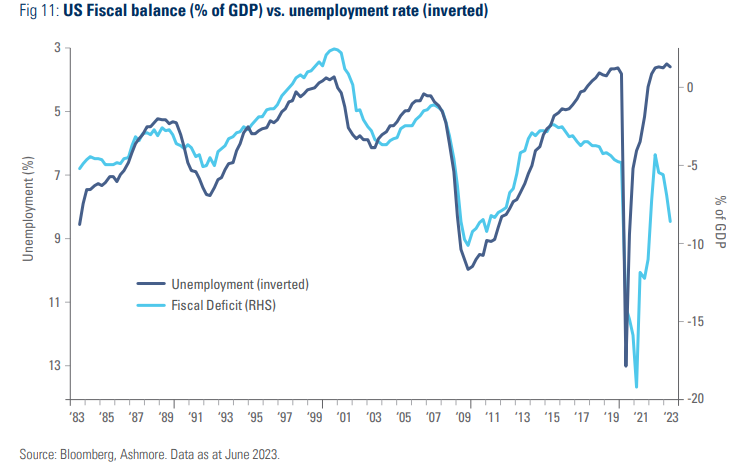
The US fiscal deficit rose to USD 228bn in June from USD 89bn in May, a cumulative deficit of USD 2.25trn over the last 12 months, or 8.6% of US GDP. Whereas the rolling deficit is exaggerated by one-off revenue declines associated with income tax postponement in areas severely affected by adverse weather conditions, such as California, the US is estimated to run a fiscal deficit of around 5.5%-6.0% of GDP in 2023 and 2024, slightly above the 5.4% level in 2022. These deficits are too large for the current stage of the cycle.
Fiscal deficits had a very strong negative correlation with the unemployment rate from 1983 to 2016, as illustrated in Fig 11. Former President Trump’s tax cuts for the corporate sector, current President Biden’s second round of paycheques to Americans in 2021 and 2023 stimulus measures (Cost of Living Adjustment, Inflation Reduction Act, and CHIPS and Science Act) changed this relationship significantly.
It will prove much harder to balance the US fiscal accounts from here. The Congressional Budget Office (CBO) projects interest payments will total USD 663bn in the fiscal year 2023 (FY23) and will climb to USD 745bn in FY24. The CBO estimates the interest burden will be higher than defence costs by FY28 and larger than nondefence discretionary spending by FY31.4
The fiscal imbalance kept the US current account on a deficit, resulting in very large twin deficits, that in the past were associated with weaker US Dollar. However, since 2017, the external deficit has been funded by foreign investors’ capital flows into the US. The overall net international liabilities (including foreign direct investment, reserve assets and others) increased by USD 9.3trn to USD 16.75trn, or 63% of GDP, as shown in Fig 12.5
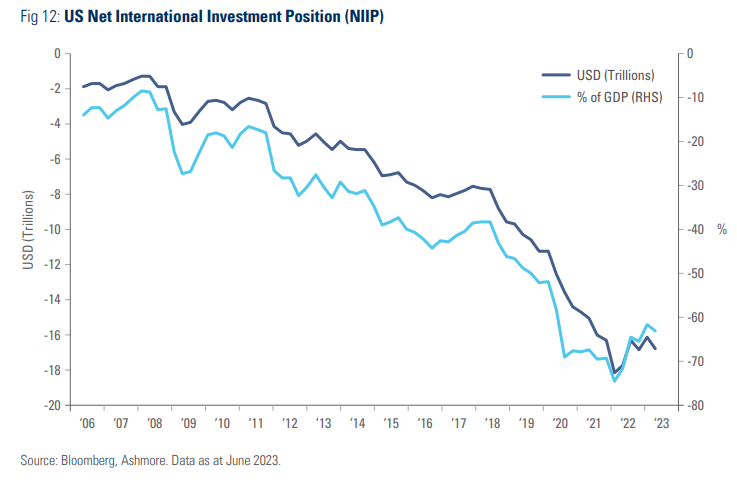
The NIIP breakdown reveals foreign investors’ exposure to US stocks doubled to USD 12trn since 2016, while foreign exposure to ‘risk-off’ trades such as US Treasuries rose by less than 20% to USD 7trn. At the same time, US investors’ exposure to foreign equities rose by 50% to USD 10trn and US investors’ exposure to foreign bonds rose by 41% to only USD 3.8trn.
The composition of the massive net liability questions whether the US Dollar can sell-off during an economic downturn. That would be a departure from the ‘Dollar Smile’ thesis, a widely-followed model that suggests the USD rises both when the US economy is booming and in a recession, and underperforms in the other environments. The USD rallies in a recession because investors buy Treasuries anticipating the US Federal Reserve (Fed) will slash policy rates. However, several elements could break down this model, in our view, including:
- A more hawkish Fed denying aggressive cuts even in the face of large equity sell-off.
- Foreign investor reluctance to add exposure to Treasuries, considering the large funding needs and issuance, which would deteriorate in a recession.
- Foreign investors selling their exposure in overvalued US stocks and repatriating their assets at a faster pace than US investors sell stocks abroad.
- US investors diversifying their exposure and investing in foreign assets.
Longstanding models such as the Dollar Smile do not break that easily. But it is very hard to build a medium-term positive picture for the ‘greenback’ considering the fundamentals and technicals above.
Another structural element calling for USD weakness is the willingness of foreign reserve managers to diversify their exposure away from the US Dollar. The sanctions imposed by the West on Russia brought the uncomfortable truth that several central banks hold reserves in countries that may be willing to change the rules of the game, depending on geopolitical events. The fact that China is actively seeking to import commodities from the Gulf countries in Renminbi and several other EM countries are seeking similar arrangements undermines the USD’s dominant role in global trade, which – alongside its military dominance and the USD convertibility and transparent rules – are the likely key reasons why central banks like holding USD reserves.
It is no secret that the BRICS (Brazil, Russia, India, China and South Africa) block has plans to launch its own currency to settle trade. There is a rumour that this currency would be backed by gold, which makes it quite interesting. If the gold convertibility is permitted exclusively to rebalance trade imbalances, the amount of gold necessary to maintain the system is much lower than full convertibility (where the country must guarantee its monetary basis). It would also become a stable alternative to the USD, including geopolitical concerns.
It Is hard to say whether investors will shun the USD in the short term. But it has sold-off for multi-year periods without losing its supremacy. These long-term grandiose developments would only add speed and/or depth to the weaker side of the Dollar cycle, in our view.
6. Impact of a Weaker US Dollar on Other EM Debt Asset Classes
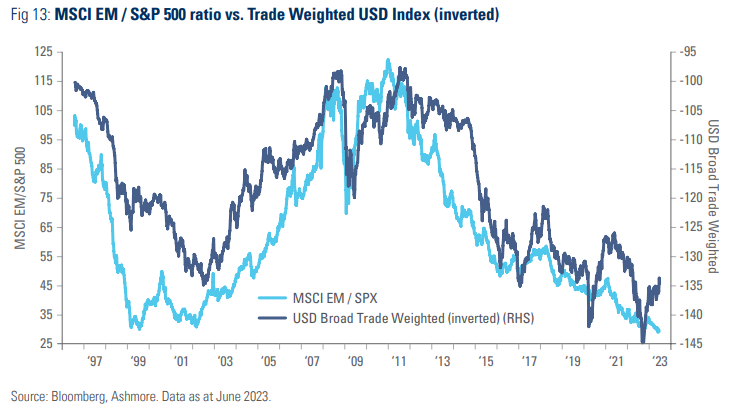
A strong USD is a strong factor leading to underperformance of EM across asset classes. The most important factor driving EM assets is growth, which is correlated with the USD cycle. This relationship is well documented by the Bank for International Settlements (BIS) and others.6 In a nutshell, EM economies rely on international liquidity (the USD system) for transactions and credit. When the Dollar strengthens, investor propensity to exit EM assets and buy US assets increases. The outflows lead to tighter capital availability in EM across several channels (foreign direct investment, bank credit and portfolio flows). As EM currency weakens, locals also try to exit, leading to even more tightness of capital in EM and completing the vicious cycle (or reflexivity). Hence, USD strength periods tends to lower potential GDP growth in EM. The impact is notable across asset classes. Fig 13 shows the ratio of the S&P 500 to MSCI EM returns against the inverted USD Index.
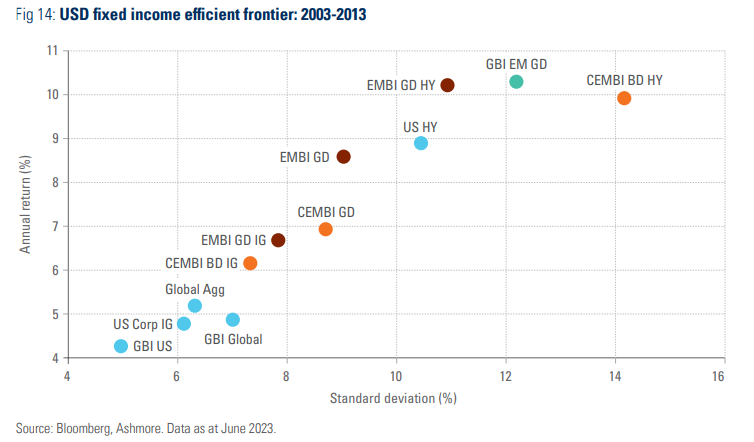
In the fixed income space, Figures 14 and 15 shows the efficient frontier across two different ten-year periods. Diversification was very important between June 2003 and June 2013, when the USD weakened. The Global Agg portfolio, dominated by USD assets but with global currency exposure, outperformed both US Treasuries (GBI US) and US Corporate IG bonds. EM fixed income dominated the efficient frontier across the board, with Sovereign and Corporate HY outperforming US HY, and LC bonds outperforming all asset classes. The EM LC (GBI EM GD) outperformance was even more pronounced in the five years up to June 2008, when the asset class rose 14.0% with only a 8.5% standard deviation.
But the efficient frontier changed dramatically over the next ten-year period from June 2013 to June 2023. Fig 15 shows both the GBI Global and EM LC returns were negative, with the Global Agg returns close to 0%. The main reason for the poor performance of benchmarks with non-USD assets, of course, was the Dollar rally. US bonds also outperformed EM debt (both IG and HY) over the period, albeit EM Corporate (CEMBI BD IG) and Sovereign IG (EMBI GD IG) did ok, despite the Russian exclusion from the indices at zero value last year. It is also notable how the sell-off in rates of 2021 and 2022 squashed returns lower and volatility higher across fixed income asset classes.
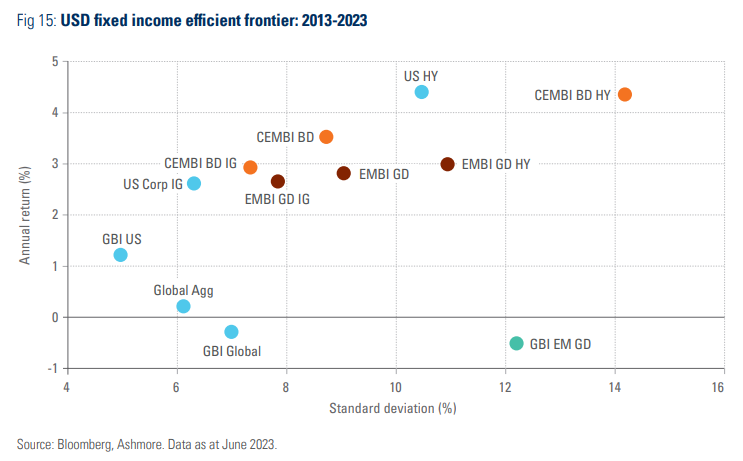
The study offers further evidence that EM risk premium declines across the board in periods of Dollar weakness, leading to EM outperformance across asset classes. If the USD weakness thesis is correct, the efficient frontier over the next 10 years will look much closer to the 2003-2013 period than the last 10-years. Therefore, any investors with lower risk tolerance (not willing to have the volatility of EM LC) should look to diversify their exposure from US (more broadly DM) to USD-denominated EM asset classes.7
Summary and Conclusion
Despite its outstanding performance over the past 18 months, foreign investors have been timid to re-engage in EM LC positions. Many investors totally gave up on the asset class after a decade when the greenback and US assets were outperforming. We believe it is time for investors to change their view and embrace EM local currency bonds.
Can EM LC outperformance last for a multi-year period? We believe yes, or “Si, se puede!” in Spanish. After all, the EM LC case rests on central banks that did a much better job in controlling inflation and inflation expectations than their DM counterparts, as well as structural economic reforms across several key EM countries. It contrasts with a very imbalanced US economy, and expensive USD (and US asset) valuations. The last 50-year cycle suggests investors should diversify away from the greenback even when they do not believe in the end of Dollar hegemony.
Finally, we believe investors unwilling to engage in non-USD exposure can capture the same trend by investing in US Dollar-denominated EM assets.
1 See – ‘Brazil’s Lower House of Congress approves key structural reforms. The Thai parliament reconvenes this week’, Weekly Research, 10 July 2023.
2 See – ‘India takes centre stage’, The Emerging View, 30 June 2023.
3 See – ‘A trip to Kuala Lumpur and Bangkok highlights nuances in local investor perspectives’, Market Commentary, 13 July 2023.
and ‘We wish all central banks were steady as Bank Negara Malaysia’, Weekly Research, 9 May 2023.
6 See – https://www.bis.org/publ/qtrpdf/r_qt2012b.htm
7 See – This study is relevant for investors with long-term liabilities (funding currency) in USD. The paper will be updated within the next few weeks with considerations for global investors in other funding currencies.
A message from Advisor Perspectives and VettaFi: Advisors who don’t grasp the implications of artificial intelligence (AI) risk being left behind. Join VettaFi for an AI Symposium on August 30th at 11am ET and hear from thought leaders and experts about how AI will transform the way investing works. Register here
This article was originally published on Advisor Perspectives on Aug 1, 2023.
