
January: Fixed Income Update
- January reported a sharp reversal in investor sentiment with equities and spread products seeing a significant rally as inflation signals continued to weaken.
- Equities reversed their December slumps, with the S&P up 6.3%, small cap stocks gaining +9.8%, and the Nasdaq jumping +10.7%. In fixed income markets, spreads tightened across Investment Grade, High Yield, and Emerging Market bonds. (Table 1)
- With persistent signs of slowing inflation—and markets expecting the Federal Reserve (Fed) to ease by the end of 2023–Treasuries saw price increases in January. The largest gains were further out on the duration curve. (Table 2)
- Economic prognosticators remain divided over whether the U.S. is headed for a soft landing or a sharp economic slowdown, with spreads and labor conditions signaling the former, while a sharply inverted yield curve foretells the latter.
January by the Numbers
Chart 1
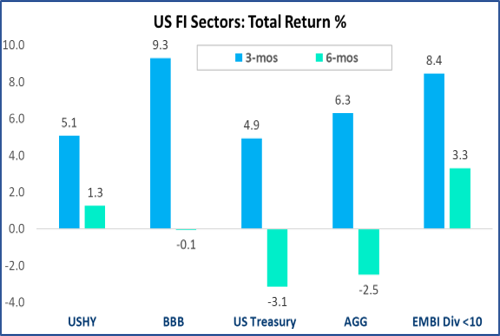
Chart 2
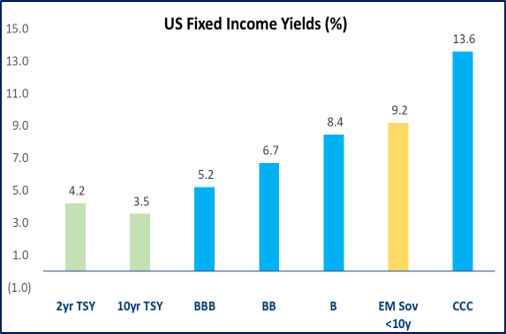
Table 1

Source: ICE Data Services, JP Morgan, Bloomberg, BondBloxx | Data as of 1/31/23
Fixed Income: U.S. Treasuries
- Price indicators continued to signal slowing inflation, with core Consumer Price Index (CPI) falling for the fourth straight month, core Producer Price Index (PPI) falling for nine months, and the Personal Consumption Expenditure (PCE) deflator registering a 11-month string of declines.
- Expectations turned to a more moderate Fed policy, with the yield on the 2-year falling over 20 bps to 4.20%, while the 10-year bond yield fell nearly 40 bps to 3.51% (Chart 3). Using TIPS as a guide, near-term inflation expectations are rather moderate at under 2.4%.
- Following this week’s as-expected +25bps rate hike, the market expects just +25-50 bps more from the Fed in the first half, with potential for policy easing by January 2024. (Chart 4)
- The yield-curve inverted further in January, which in the past has been a somewhat consistent indicator of recession. Two key measures are the 10-year vs. 2-year curve, which is at -76 bps, and the 10-year vs. 3-month curve, which is at -116 bps.
Chart 3
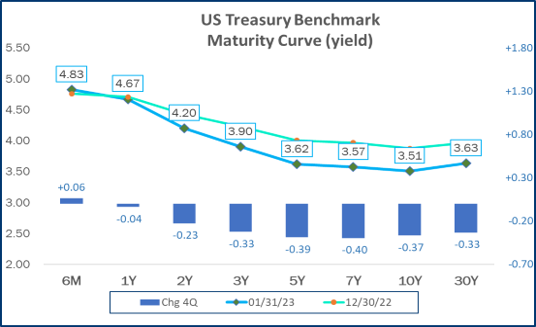
Chart 4
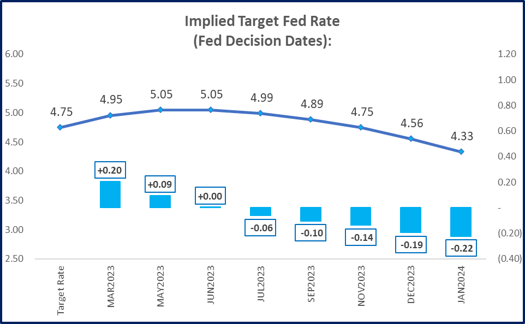
Table 2
Source: ICE Data Services, JP Morgan, Bloomberg, BondBloxx | Data as of 1/31/23
Fixed Income: Emerging Markets Debt
- Emerging Market (EM) bonds capped off a strong 3-month run, as a falling dollar and attractive valuations help to drive bond prices higher. Broad benchmarks of EM debt are up +8-11% for the 3-month period, after posting returns of +2-3% in January. (Table 3)
- Spreads on EM Debt have tightened over 100 bps since October, with EM being a relatively liquid asset class for investors to take on nearly double-digit yields. (Table 3)
- Not surprisingly, the riskiest part of the market performed best in January, with High Yield EM rising +3.8% in January, while Investment Grade EM was up +2.6%. (Table 3)
- While all global regions generated positive returns in January, Latin America saw the biggest gains, while the Middle East lagged. This pattern is in line with risk-on country groups and falling oil prices.
- Emerging market spreads are highly correlated with the US dollar, which has fallen since late September. (Chart 6)
Chart 5
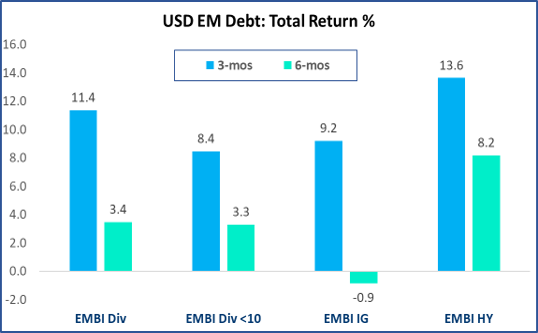
Chart 6
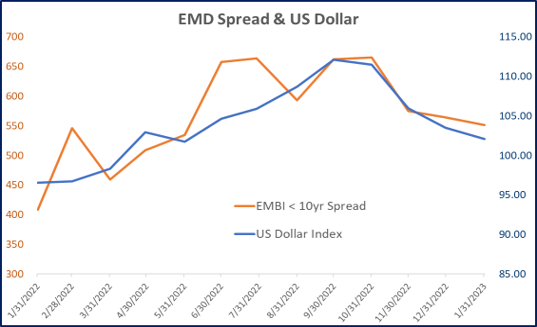
Table 3
Fixed Income: U.S. High Yield Ratings
- High Yield had a very strong month, with a +3.9% return for the asset class, and is now in positive territory for the 1, 3, and 6-month time periods. (Table 1)
- The rebound in investor sentiment was most pronounced when looking at rating sectors, with CCCs reporting a +6.0% return in January vs. +3.3% for BBs. This is even more impressive when we account for the fact the BB’s had the benefit of one year of added duration. (Table 4)
- Spreads tightened across High Yield in January, but CCCs saw the biggest improvement, with a 120 bps tightening in just one month. (Table 4)
- January saw a rise in defaults from the fourth quarter, with several companies filing in the high yield and loan space during the month. While the 12-month default rate has increased, it remains under 2%, which is below the long-term average of about 3% for High Yield.
Chart 7
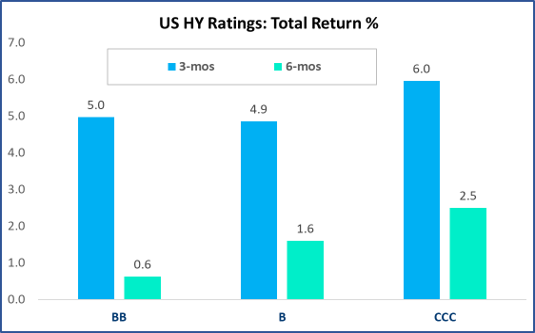
Chart 8
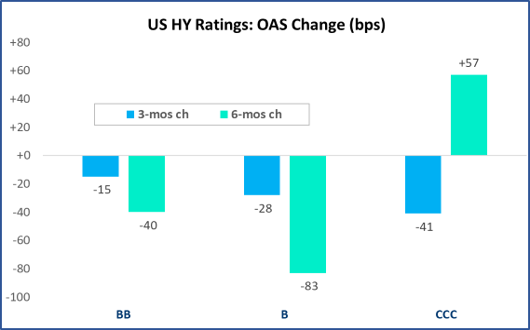
Table 4
Source: ICE Data Services, JP Morgan, Bloomberg, BondBloxx | Data as of 1/31/23
Fixed Income: U.S. High Yield Sectors
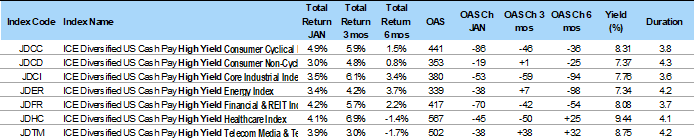
- High Yield Sector returns varied between +3.0% (Consumer Non-Cyclicals) and +4.9% (Consumer Cyclicals) in January. (Table 5)
- During the recent 3-month period, HY Industrials, up +6.1% for the period, more than double the return of HY Telecom, which returned +3.0%. (Chart 9)
- The last 6-months have shown an interesting disparity within High Yield, with HY Energy and Industrials returning +3.7% and +3.4%, respectively, while Telecom and Healthcare are both in negative territory at -1.7% and -1.4%, respectively. (Chart 9)
- Over the last several months the Energy and Industrial sectors have been lifted by strong performance from large issuers such as Occidental Petroleum, EQM Midstream, First Energy, and Albertsons, while lagging sectors such as Telecom and Healthcare were impacted by credit struggles at issuers such as CSC Holdings and Bausch Health Cos.
Chart 9
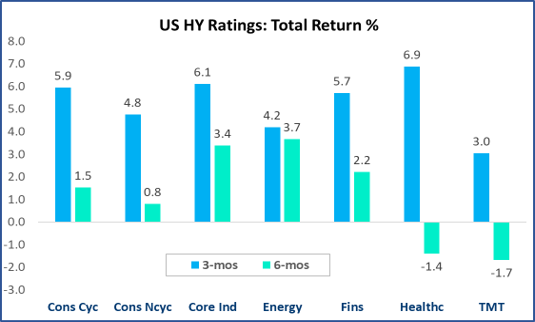
Chart 10
Table 5
Source: ICE Data Services, JP Morgan, Bloomberg, BondBloxx | Data as of 1/31/23
Glossary and Index Definitions
- The ICE BofA U.S. High Yield Index tracks the performance of U.S. dollar-denominated, below investment grade-rated corporate debt publicly issued in the U.S. domestic market.
- The ICE BofA Broad Market Index measures the performance of U.S. dollar-denominated, investment grade debt securities, including U.S. Treasury notes and bonds, quasi-government securities, corporate securities, residential and commercial mortgage-backed securities and asset-backed securities.
- The ICE BofA U.S. Corporate Index tracks the performance of U.S. dollar-denominated investment grade rated corporate debt publicly issued in the U.S. domestic market.
- The ICE BofA U.S. Treasury Index tracks the performance of U.S. dollar denominated sovereign debt publicly issued by the U.S. government in its domestic market.
- The ICE BofA Current 10-year U.S. Treasury Index is a one-security index comprised of the most recently issued 10-year U.S. Treasury note.
- The Bloomberg U.S. Treasury 10-Year Duration Index is an index designed to target a 10-year duration using U.S Treasury securities. The index is constructed using U.S. Treasury Notes/Bonds in Bloomberg’s U.S. Treasury Index with durations in two bucket ranges, namely 6-10 year durations and 10-14 year durations.
- The ICE Diversified U.S. Cash Pay High Yield Rating Category Indices contain all securities in the ICE BofA U.S. Cash Pay High Yield Index, broken down by their rating categories: BB1-BB3, B1-B3, and CCC1-CCC3. Index constituents are capitalization-weighted, based on their current amount outstanding.
- The JP Morgan EMBI Global Diversified Index tracks total returns for traded external debt instruments in the emerging markets, including U.S. dollar-denominated Brady bonds, loans, and Eurobonds with an outstanding face value of at least $500 million.
- The J.P. Morgan 1-10 Year Emerging Markets Sovereign Index tracks liquid, U.S. dollar emerging market fixed and floating-rate debt instruments issued by sovereign and quasi sovereign entities. The EMBIGDL 1-10 Index is based on the long-established J.P. Morgan EMBI Global Diversified Index and follows it methodology closely, but only includes securities with at least $1 billion in face amount outstanding and average life below 10 years.
- The S&P 500 Index tracks the performance of 500 leading large-cap U.S. equities and covers approximately 80% of available market capitalization.
- The NASDAQ Composite Index measures all NASDAQ domestic and international based common type stocks listed on The NASDAQ Stock Market, including over 2,500 companies, An investment can not be made in an index
- Credit Spread: the difference in yield between a debt security and its benchmark measured in basis points
Carefully consider each Fund’s investment objectives, risks, charges, and expenses before investing. This and other information can be found in each respective Fund’s prospectus or, if available, the summary prospectus, which may be obtained by visiting bondbloxx.com. Read the prospectus carefully before investing.
There are risks associated with investing, including possible loss of principal. Fixed income investments are subject to interest rate risk; their value will normally decline as interest rates rise. Fixed income investments are also subject to credit risk, the risk that the issuer of a bond will fail to pay interest and principal in a timely manner, or that negative perceptions of the issuer’s ability to make such payments will cause the price of that bond to decline. Investing in mortgage- and asset backed securities involves interest rate, credit, valuation, extension and liquidity risks and the risk that payments on the underlying assets are delayed, prepaid, subordinated or defaulted on.
Distributor: Foreside Fund Services, LLC.
BondBloxx Investment Management Corporation (“BondBloxx”) is a registered investment adviser. The content of this presentation is intended for informational purposes only and is not intended to be investment advice. Not for distribution to the public.
Nothing contained in this presentation constitutes investment, legal, tax, accounting, regulatory, or other advice. Information contained in this presentation does not constitute an offer to sell or a solicitation of an offer to buy any shares of any BondBloxx ETFs. The investments and strategies discussed may not be suitable for all investors and are not obligations of BondBloxx.
Decisions based on information contained in this presentation are the sole responsibility of the intended recipient. You should obtain relevant and specific professional advice before making any investment decision. This information is subject to change without notice.
BondBloxx makes no representations that the contents are appropriate for use in all locations, or that the transactions, securities, products, instruments, or services discussed are available or appropriate for sale or use in all jurisdictions or countries, or by all investors or counterparties. By making this information available, BondBloxx does not represent that any investment vehicle is available or suitable for any particular investor. All persons and entities accessing this information do so on their own initiative and are responsible for compliance with applicable local laws and regulations.
Bond ratings are grades given to bonds that indicate their credit quality as determined by private independent ratings services, such as Standard & Poor’s, Moody’s and Fitch. These firms evaluate a bond issuer’s financial strength or it’s ability to pay a bond’s principal and interest in a timely fashion. Ratings are expressed as letters ranging from ‘AAA’, which are the highest grade, to ‘D’, which is the lowest grade.
Index performance is not illustrative of fund performance. One cannot invest directly in an index. Please visit bondbloxx.com for fund performance.
Institutional Use Only – Not for Distribution to The Public
