
Economic indicators are released each week to provide insight into the overall health and performance of the U.S. economy. They play a crucial role in enabling policymakers, advisors, investors, and businesses to assess current economic conditions. This facilitates informed decisions regarding business strategies and financial markets. In the week ending January 18, the SPDR S&P too ETF Trust (SPY) rose 0.03%, while the Invesco S&P 500® Equal Weight ETF (RSP) was down 1.13%. The U.S. housing market took center stage last week as the latest data on several housing-related indicators was released.
This article highlights crucial housing indicators from the past week. These include existing home sales, housing starts, builder confidence, and building permits. These indicators provide a comprehensive overview of the housing market.
The housing indicators discussed in this article could impact homebuilders and residential real estate ETFs. These include the Invesco Dynamic Building & Construction ETF (PKB), iShares U.S. Home Construction ETF (ITB), SPDR S&P Homebuilders ETF (XHB), and iShares Residential and Multisector Real Estate ETF (REZ).
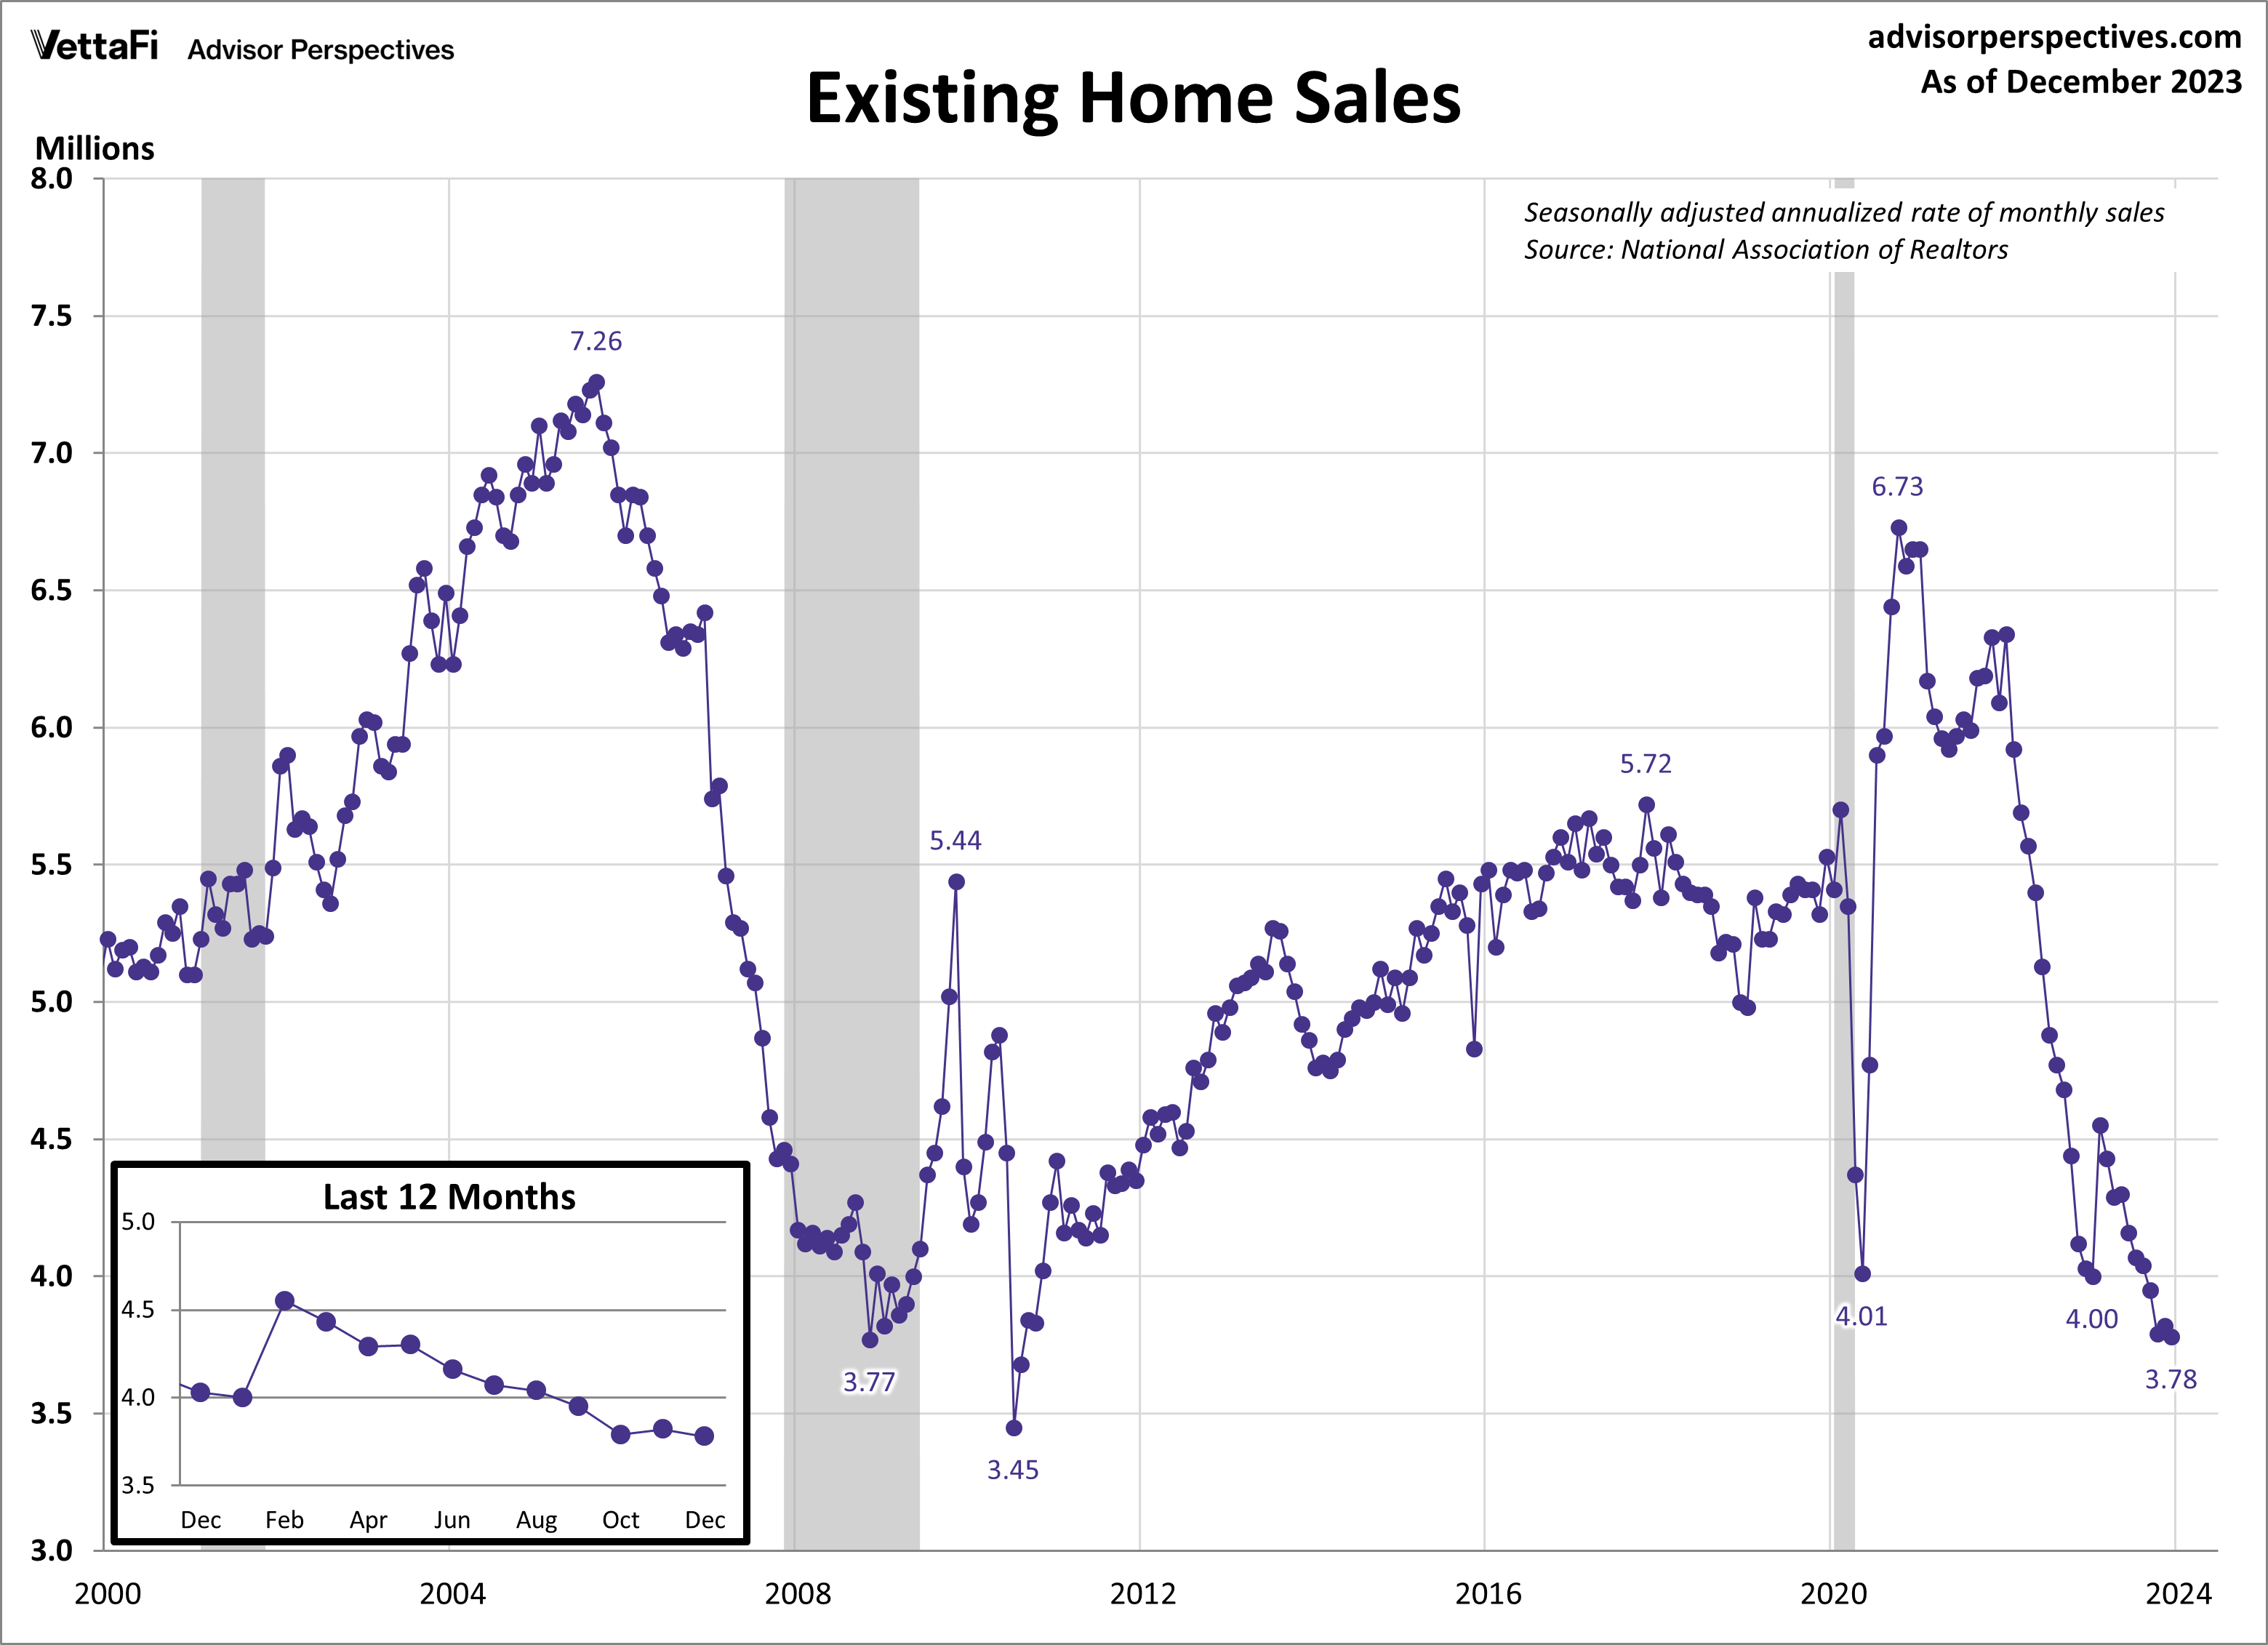
Existing Home Sales
Existing home sales retreated last month. dropping to their slowest pace since 2010. In December, existing home sales fell 1.0%, settling at a seasonally adjusted annual rate of 3.78 million units. This decline marks the 20th drop in the past 23 months. That highlights the consistent downward trajectory in existing home sales over the past two years. The latest figure was lower than expected. Sales fell short of the projected 3.82 million units. While inventory remains low, the National Association of Realtors predicts that recent drops in mortgage rates will result in increased inventory in 2024 and ultimately an improvement in home sales.
The lack of inventory has created competition among potential homebuyers. This has led to multiple offers on a home and subsequent price hikes. The median price for an existing home sold in December was $382,600. That represents a 4.4% increase compared to one year ago. This is the sixth straight month of year-over-year increases for existing homes.
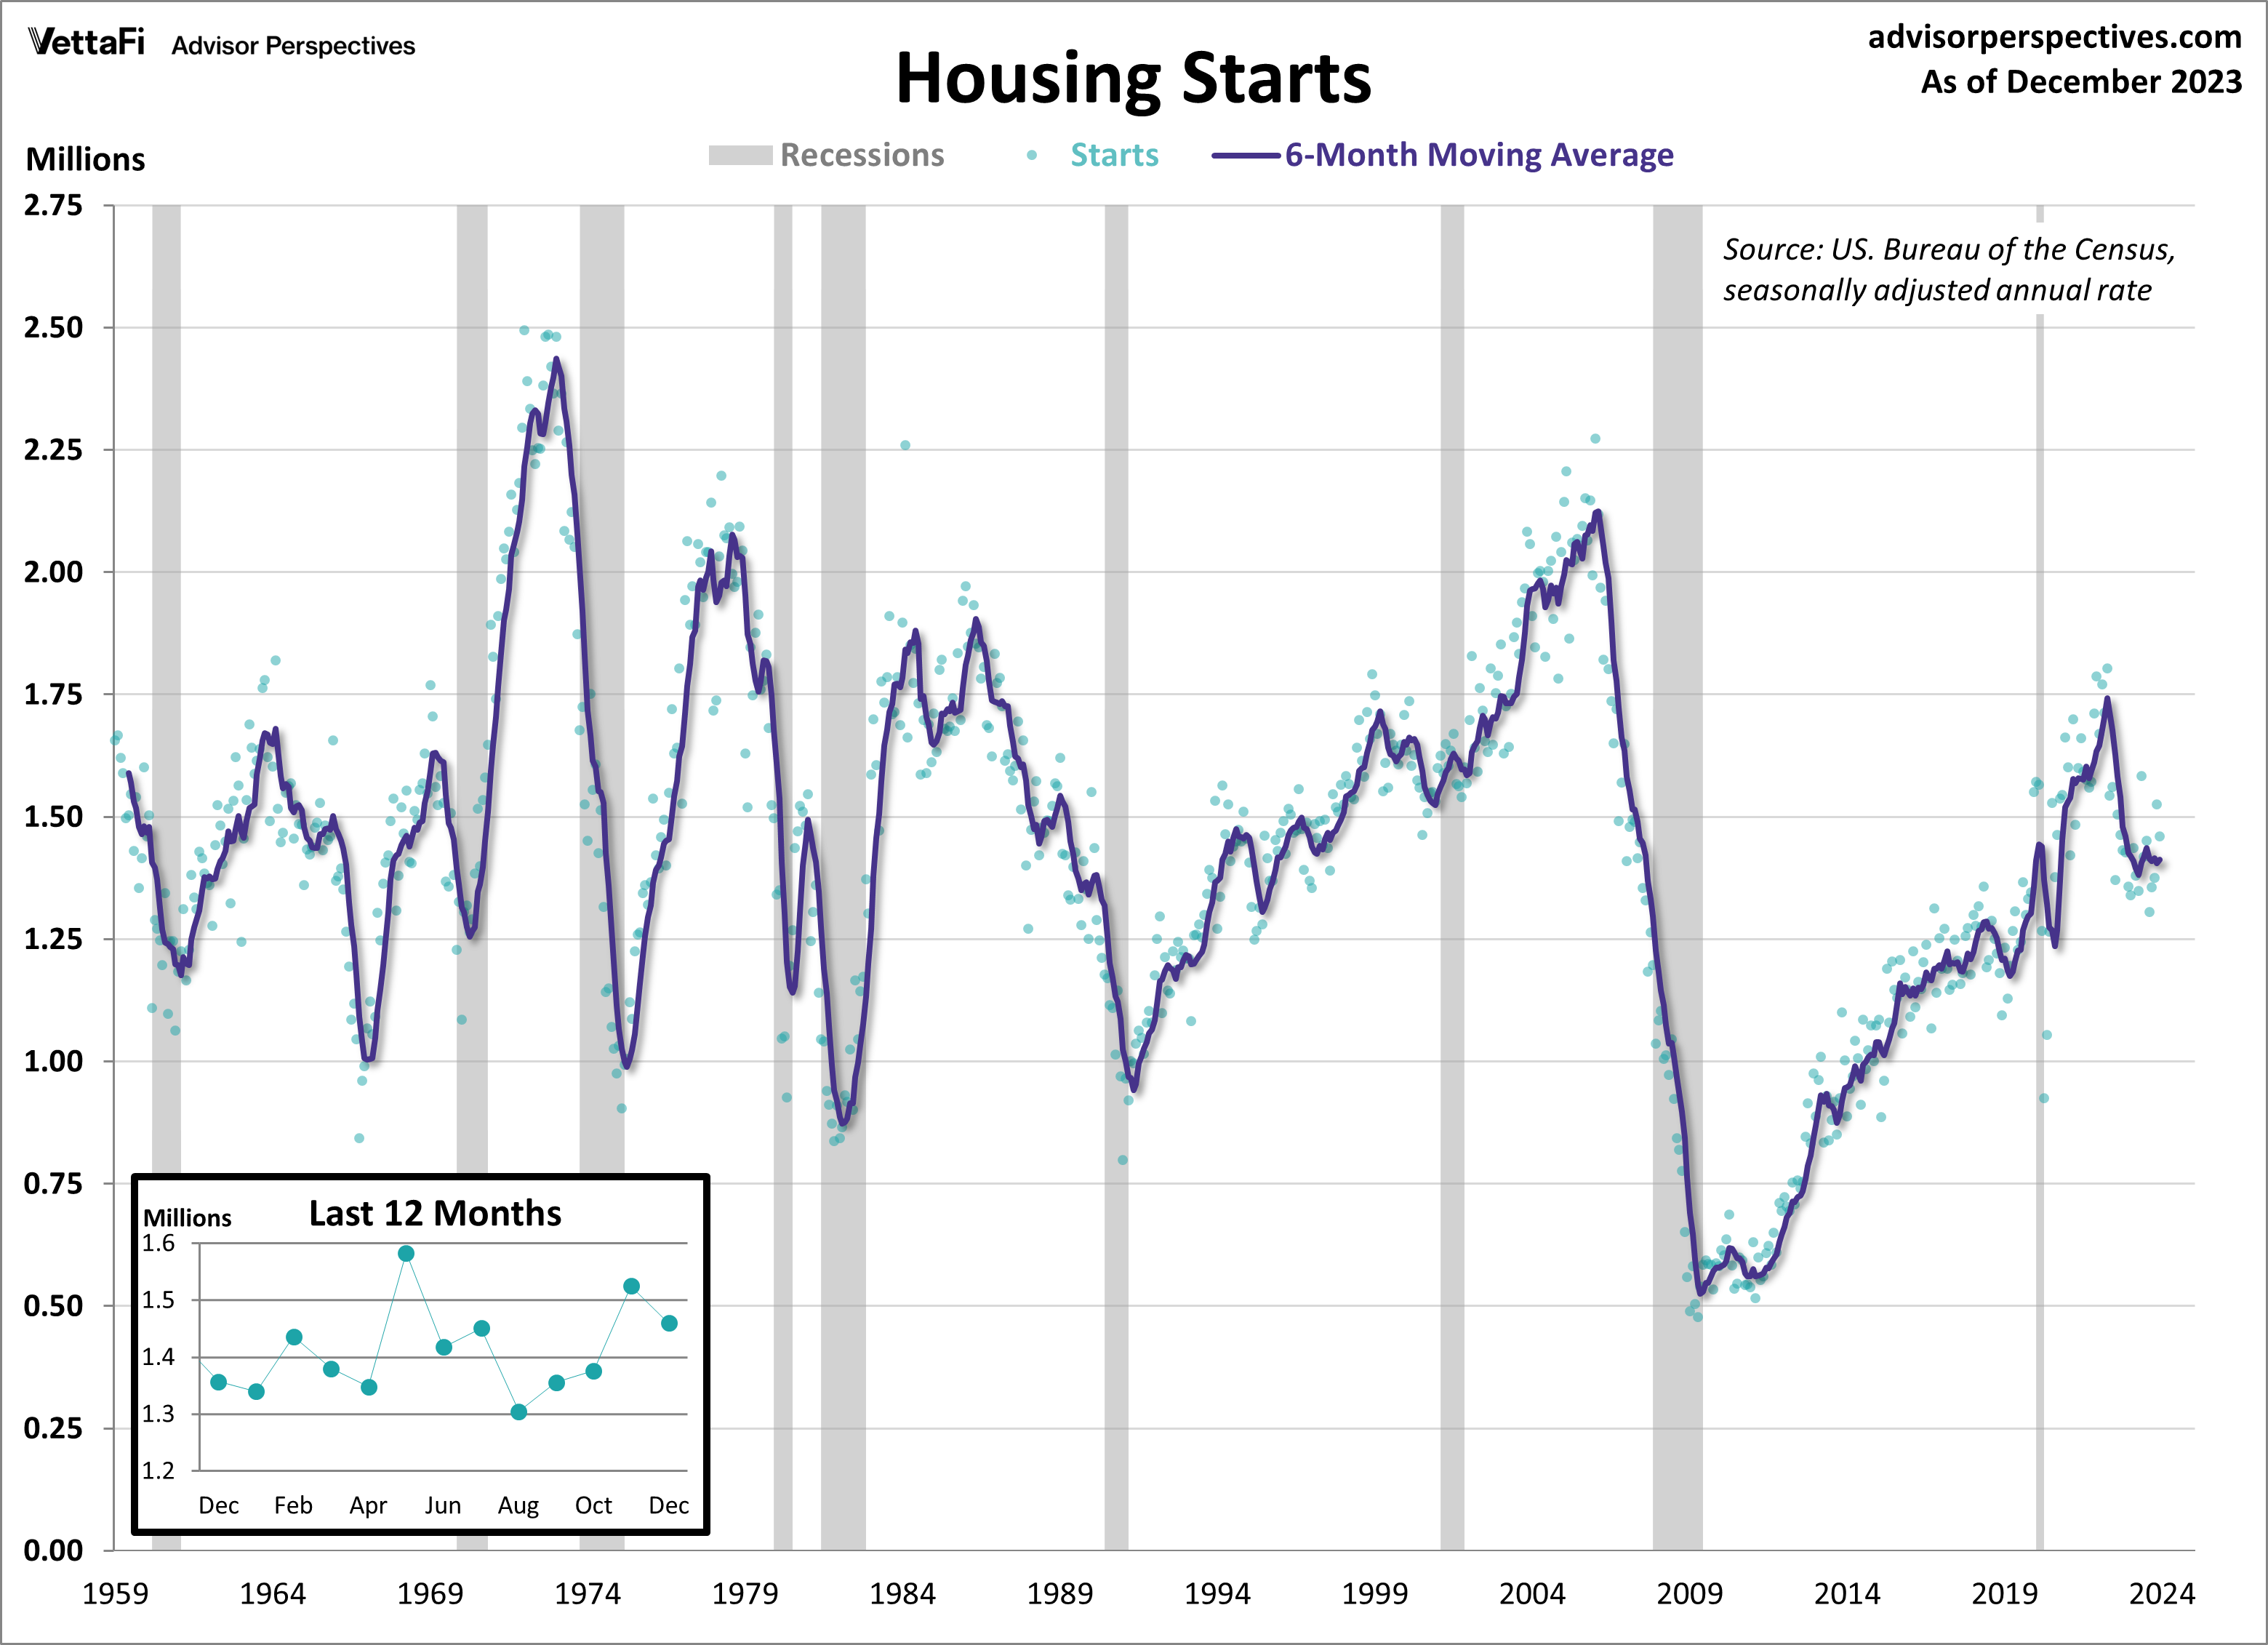
Housing Starts
New home construction retreated for the first time in four months in December. That’s despite falling mortgage rates and rising builder confidence. Housing starts fell by 4.3% to a seasonally adjusted annual rate of 1.460 million units. That surpassed the anticipated pace of 1.426 million units. This marked the first monthly decline since August and a 7.6% year-over-year growth. A breakdown of the data revealed that single-family units were the cause of this month’s decline. That is due to construction activity for this type of unit dropping by 8.6% from November. Meanwhile, multifamily unit construction jumped 7.5%.
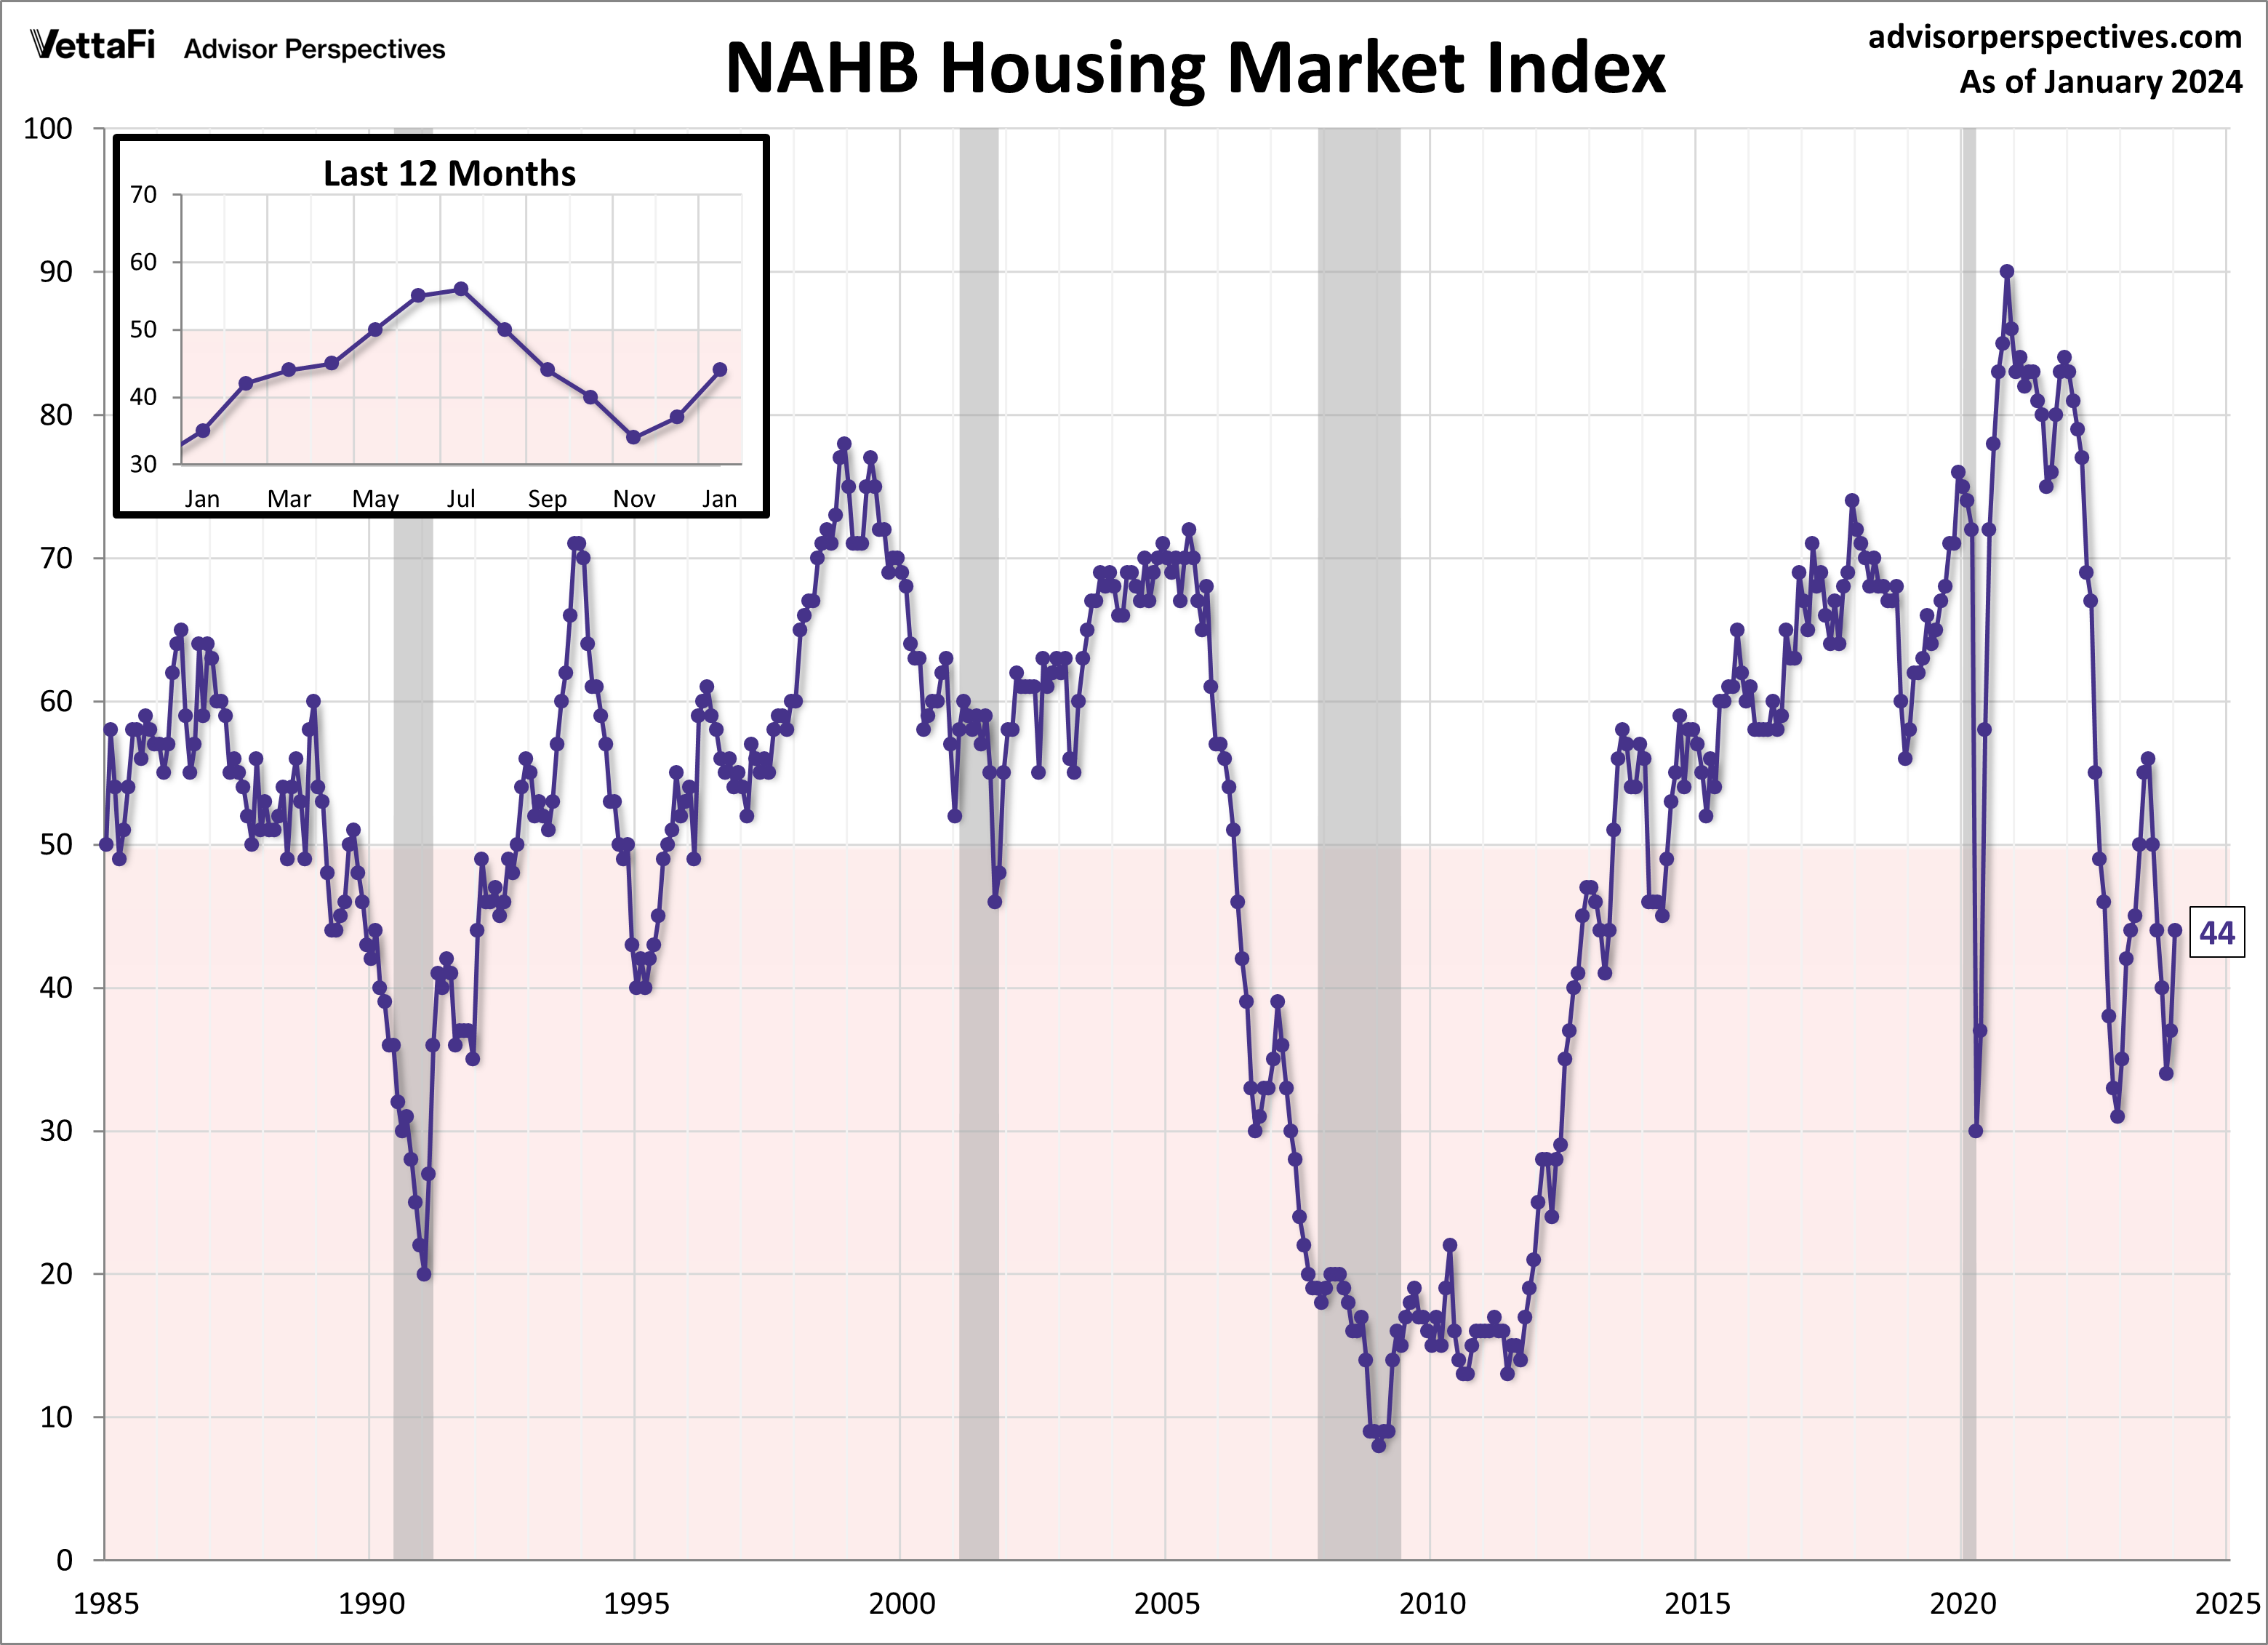
Despite the decline in housing starts in December, confidence among homebuilders has gained ground in recent months. The NAHB housing market index, which measures builder opinion on current and future home sales, rose for a second straight month to its highest level since September. With mortgage rates dropping below 7%, homebuilders have seen more current home buying activity. And are optimistic about construction activity for 2024.
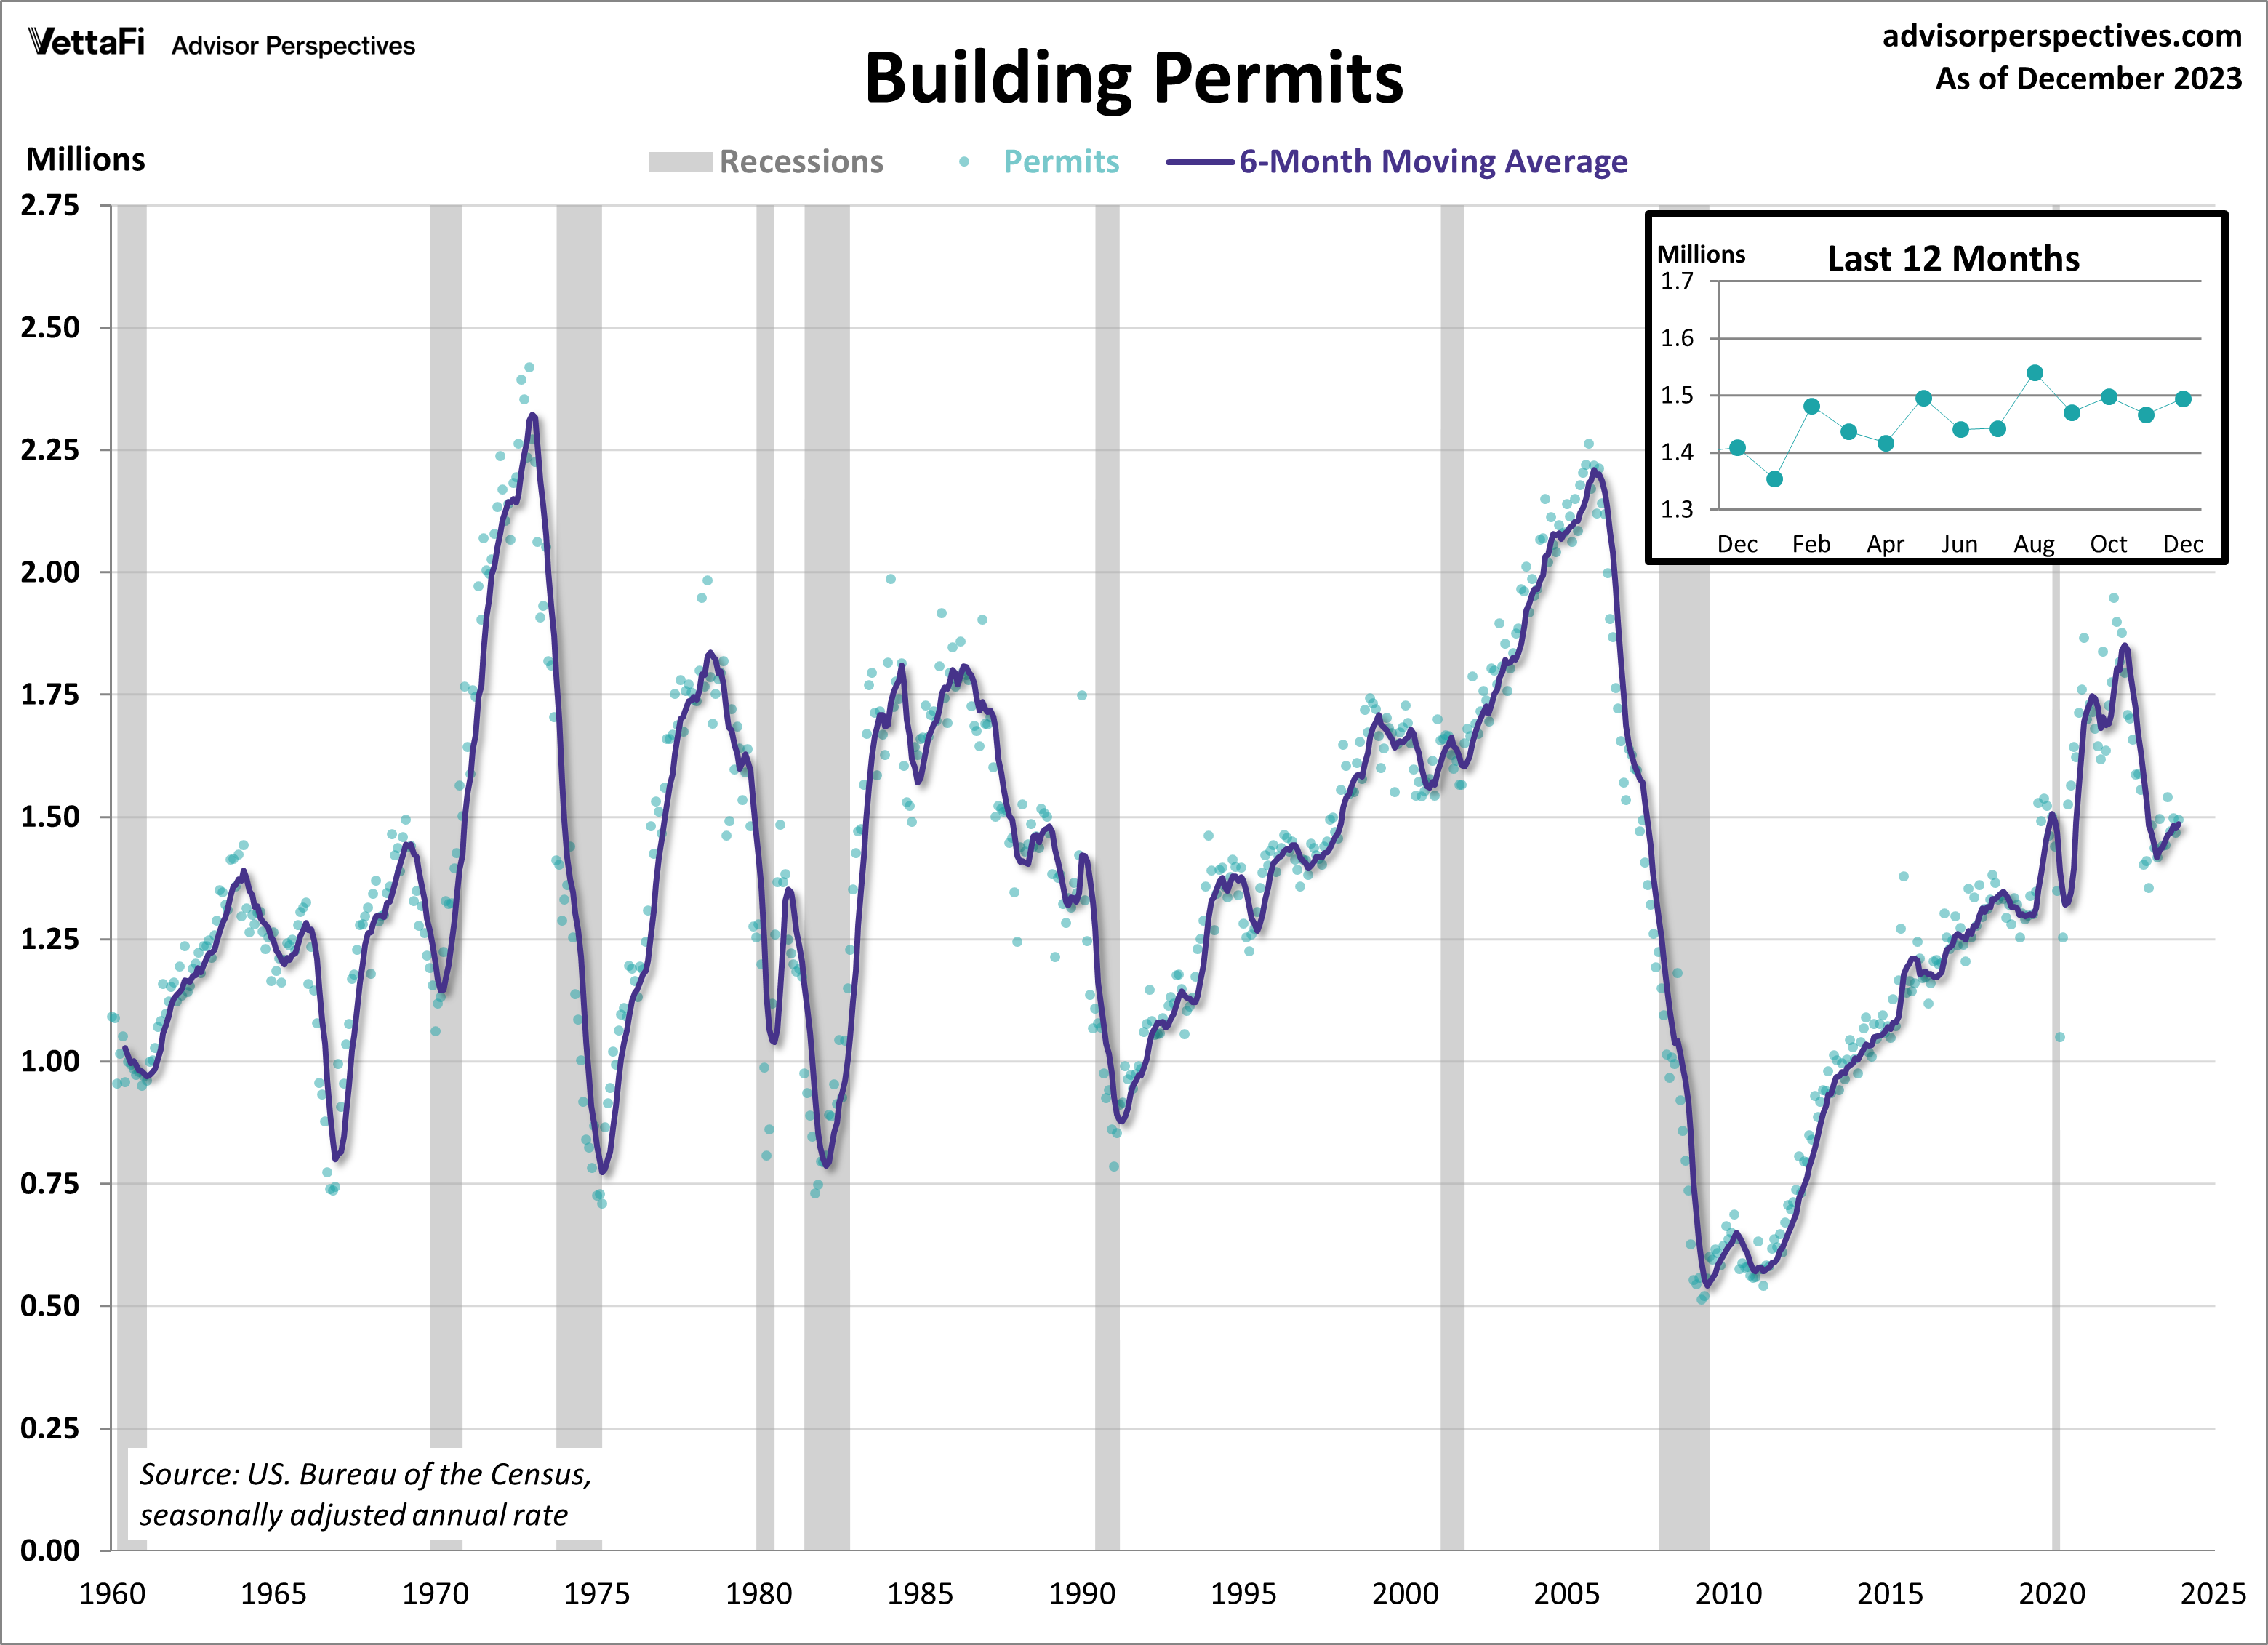
Building Permits
New residential building permits rose more than expected in December, underscoring the recent uptick in builder confidence. Last month, building permits increased 1.9% from November, reaching a seasonally adjusted annual rate of 1.495 million units, exceeding the expected rate of 1.480 million units. Additionally, building permits are up 6.1% compared to one year ago, marking the highest level since March 2022. Building permits play a pivotal role in gauging future construction activity, making them a crucial indicator of housing market demand. December’s data could offer hints at what housing activity will look like for 2024.
Economic Indicators and the Week Ahead
Next week will feature a few more housing indicators, including December’s new and pending home sales. New home sales are expected to rise to a seasonally adjusted annual rate of 650,000, while pending home sales are projected to increase from November.
Additionally, the advance estimate for the 2023 Q4 GDP and December’s PCE price index will be released. These closely watched indicators both offer insight into the U.S.’ economic activity, with GDP representing a total value, and PCE focusing specifically on consumer spending. The 2023 Q4 advance estimate is forecast to come in at 1.8%, down from the 2023 Q3 final estimate of 4.9%. The core PCE price index, the Fed’s preferred measure of inflation, will be released on Friday. In it, we’ll learn if inflation continued to cool through the end of 2023.
For more news, information, and strategy, visit the Innovative ETFs Channel.
